Last updated: May 9, 2025
How to Monitor and Debug Terragrunt & Terraform/Opentofu Using Opentelemetry
Terraform, OpenTofu, and Terragrunt are popular infrastructure management and deployment tools.
Terraform, developed by HashiCorp, is a widely-used Infrastructure as Code (IaC) tool that allows users to define, provision, and manage cloud resources across multiple platforms using a declarative language called HashiCorp Configuration Language (HCL). HashiCorp was bought in 2024 by IBM and changed the Terraform license.
OpenTofu is an open-source fork of Terraform and now part of the Linux Foundation. It maintains backward compatibility with Terraform, allowing for seamless transitions and supporting existing workflows.
Terragrunt is a thin wrapper around Terraform/OpenTofu, that provides additional features to improve infrastructure management. It promotes DRY (Don't Repeat Yourself) configurations, simplifies remote state management, and offers versioning capabilities for Terraform/OpenTofu modules.
We use Terragrunt for managing all of our static cloud infrastructure. To help with debugging and improving our Terragrunt workflow we are sending OpenTelemetry logs, metrics and traces from Terragrunt to Dash0.
This blog post explains how to configure Terragrunt to collect OpenTelemetry data when running everything on your local machine. We use Atlantis to plan & apply all Terragrunt/Terraform changes via GitHub pull requests. We will explain that setup in a future blog post.
Getting started
Currently Terragrunt only supports sending telemetry data to a locally running OpenTelemetry collector. At Dash0 we run Atlantis on an EC2 instance with a collector to collect all Terragrunt metrics, logs and traces.

Prerequisites
To experiment with the tools in this blog post you need:
- Docker installed locally
- Existing Terragrunt project
- Terragrunt version 0.72.0 or newer
- Terraform
- A free Dash0 trial account, https://www.dash0.com/sign-up
Step 1: Run OpenTelemetry collector
Please download this OpenTelemetry collector YAML configuration first and save it locally as config-blog-post.yaml, https://www.otelbin.io/s/8fd6d3e8f31f48b04ae3b018bf691d4860815fc5
Then replace <AUTH_TOKEN> in config-blog-post.yaml with the auth token from your Dash0 organization. If you do not have an organization you can quickly spin up a free two week trial under https://www.dash0.com/sign-up
Then you can start the collector using the following docker command:
1docker run -p 4317:4317 -p 4318:4318 -v $(pwd)/config-blog-post.yaml:/etc/otelcol-contrib/config.yaml ghcr.io/open-telemetry/opentelemetry-collector-releases/opentelemetry-collector-contrib:0.114.0
Step 2: Set environment variables
Open a terminal and go to a Terragrunt directory where you would typically run your terragrunt commands. Set the following environment variables:
1234567export TERRAGRUNT_TELEMETRY_TRACE_EXPORTER=httpexport TERRAGRUNT_TELEMETRY_TRACE_EXPORTER_HTTP_ENDPOINT=localhost:4318export TERRAGRUNT_TELEMETRY_TRACE_EXPORTER_INSECURE_ENDPOINT=trueexport TERRAGRUNT_TELEMETRY_METRIC_EXPORTER=grpcHttpexport TERRAGRUNT_TELEMETRY_METRIC_EXPORTER_INSECURE_ENDPOINT=trueexport OTEL_EXPORTER_OTLP_ENDPOINT=http://localhost:4317
Step 3: Run terragrunt
Run terragrunt plan/apply commands. Terragrunt will automatically send all telemetry data to the locally running collector which will forward the data to the Dash0 OpenTelemetry backend. The following arguments make sure that terragrunt writes structured logs in JSON format.
123terragrunt run-all plan \--terragrunt-log-format=json \--terragrunt-non-interactive
While running terragrunt, it will automatically send all OpenTelemetry data to the running collector instance. This collector then forwards the data to your Dash0 organization.
Using OpenTelemetry data from terragrunt
Support for exporting OpenTelemetry data was added at the beginning of 2024 to Terragrunt, see https://github.com/gruntwork-io/terragrunt/issues/2919
Here is the initial list of what data is being collected:
- What commands are running and in which folders.
- Whether each command succeeded or failed.
- How long each command took.
- What steps Terragrunt did internally (e.g., file system scanning, config parsing, auto-init, hook execution, etc) to process the command.
- How long each step took.
- Whether each step succeeded or failed.
- What TF modules and providers, and at which versions, were used.
- How long it took to download them.
- How big they are on disk.
Example use cases
Example 1: Get error messages from spans in the tracing view
From the spans you get detailed information on errors with the full error message.

Example 2: Create dashboards for terragrunt exceptions
Based on the span data you can create charts and alerts when exceptions occur during terragrunt plan and apply lifecycles. Here is an example PromQL query:
12345678max by (service_name, otel_span_event_name) (increase({otel_metric_name = "dash0.span.events",service_name = "terragrunt"}[$__rate_interval]))
This is what a chart would look like for the PromQL query above.

Example 3: Get notified when changes to resources are applied
123456789sum by (service_namespace, service_name, dir, args) (increase({otel_metric_name = "dash0.spans",service_name = "terragrunt",args =~ ".*apply.*"}[$__interval]))

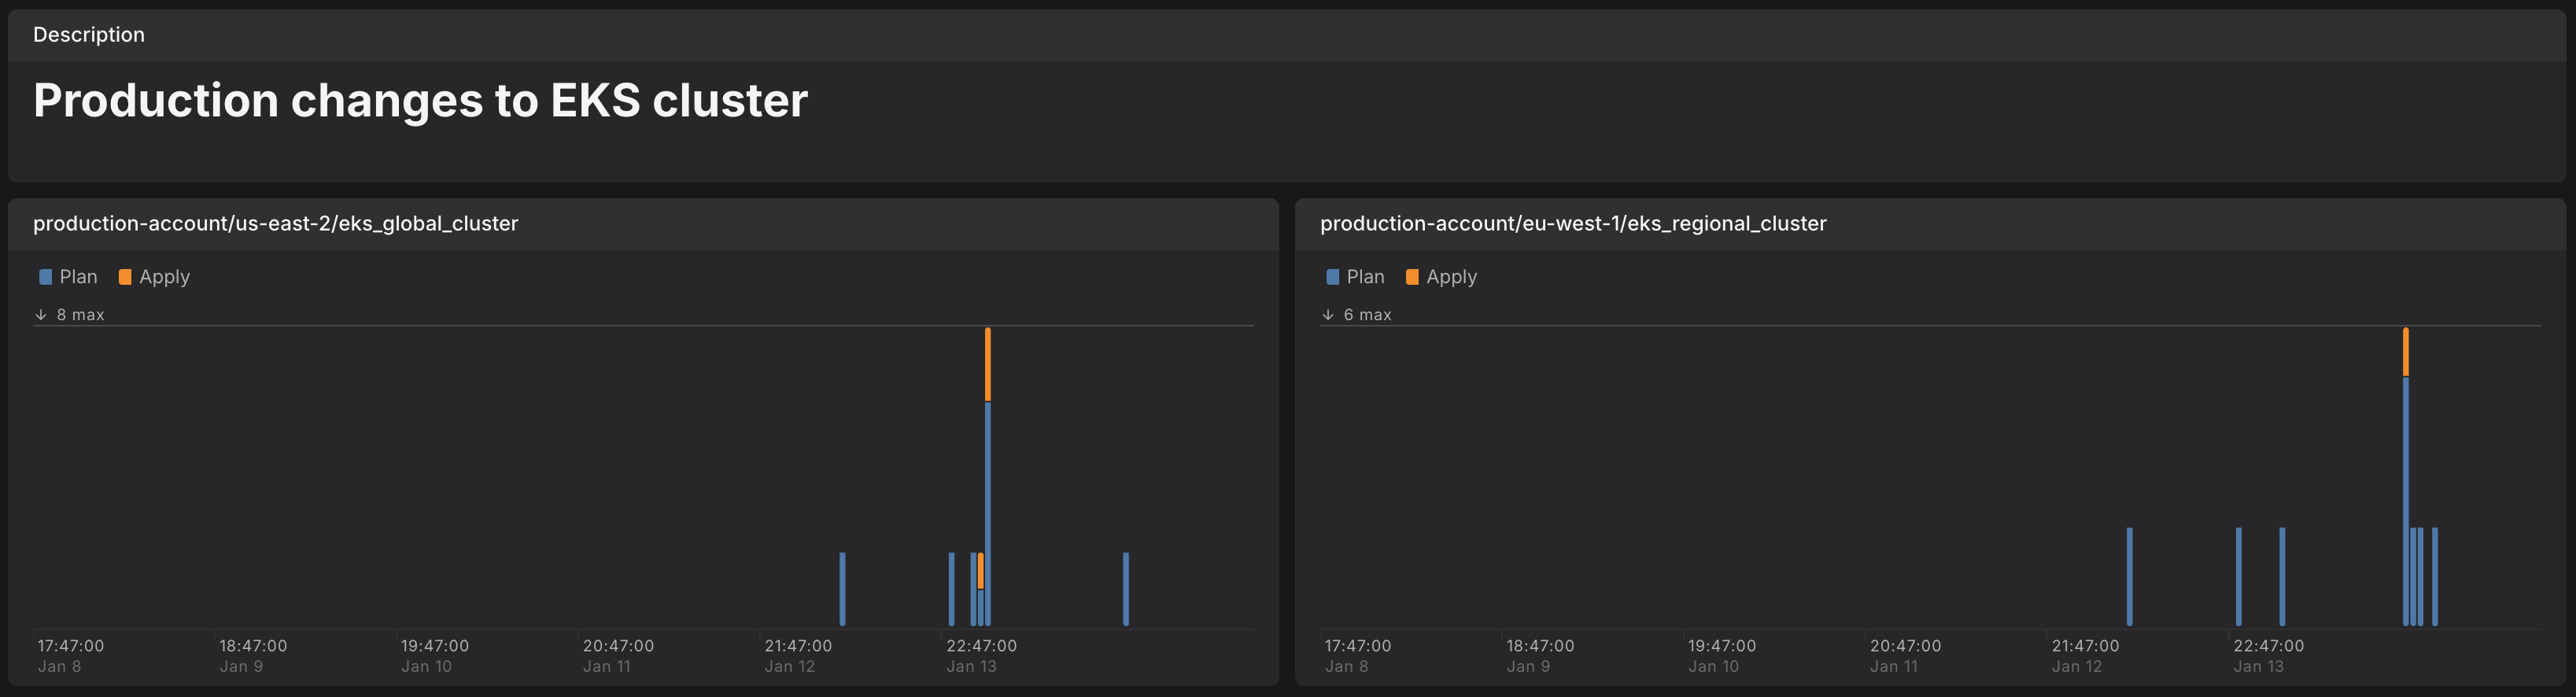
Example 4: Get notified when changes to critical production resources are applied
This is useful when you want to be notified when critical resources are updated, like the Kubernetes cluster.
12345678910sum by (service_namespace, service_name) (increase({otel_metric_name = "dash0.spans",service_name = "terragrunt",dir =~ ".*production.*eks_cluster.*",args =~ ".*apply.*"}[$__interval]))
Example 5: Terragrunt debugging metrics
In our integration hub we added a Terragrunt dashboard that is using most of the metrics that are available. The dashboard helps you identify which versions of Terragrunt are used, to make sure everything is consistent. Additionally it helps understanding the durations of Terragrunt runs as well as if the various caches are used and working correctly.

Spans
You can easily find all Terragrunt spans by using the following filters:
service.name = terragrunt
or
deployment.environment.name = terragrunt-local
Then you can find only Terragrunt related traces and slice and dice through them using Dash0.


Metrics
You can find all Terragrunt metrics data in the metrics explorer by using the following filters:
service.name = terragrunt
or
deployment.environment.name = terragrunt-local

Summary
This blog post has walked you through the process of integrating OpenTelemetry with Terragrunt, Terraform/OpenTofu to enhance your infrastructure management workflow. By implementing these practices, you're taking a significant step towards more observable, manageable, and efficient infrastructure operations. As you become more familiar with these tools, you'll be able to fine-tune your processes and make data-driven decisions about your infrastructure management strategies.
Appendix A: Flat list explaining Terragrunt OpenTelemetry metrics
- check_for_cycles_duration Measures the time taken to check for dependency cycles in the Terragrunt configuration
- check_for_cycles_success_count Counts successful cycle checks in the dependency graph.
- create_stack_for_terragrunt_config_paths_duration Tracks the time needed to create a stack from Terragrunt configuration paths.
- create_stack_for_terragrunt_config_paths_success_count Counts successful stack creations from configuration paths.
- crosslink_dependencies_duration Measures the time taken to link dependencies across modules.
- crosslink_dependencies_success_count Counts successful cross-linking of dependencies.
- dependencyOutputCache_cache_get_count Tracks the number of dependency output cache retrieval attempts.
- dependencyOutputCache_cache_hit_count Counts successful dependency output cache hits.
- dependencyOutputCache_cache_miss_count Counts dependency output cache misses.
- dependencyOutputCache_cache_put_count Tracks the number of items added to the dependency output cache.
- download_terraform_source_duration Measures the time taken to download Terraform source code.
- download_terraform_source_success_count Counts successful Terraform source downloads.
- existingModules_cache_get_count Tracks retrieval attempts from the existing modules cache.
- existingModules_cache_hit_count Counts successful hits in the existing modules cache.
- existingModules_cache_miss_count Counts misses in the existing modules cache.
- existingModules_cache_put_count Tracks additions to the existing modules cache.
- find_files_in_path_duration Measures the time taken to find files in a given path.
- find_files_in_path_success_count Counts successful file-finding operations.
- flag_excluded_dirs_duration Tracks time spent identifying excluded directories.
- flag_excluded_dirs_success_count Counts successful exclusion of directories.
- flag_excluded_units_duration Measures time taken to flag excluded units.
- flag_excluded_units_success_count Counts successful unit exclusions.
- flag_included_dirs_duration Tracks time spent identifying included directories.
- flag_included_dirs_success_count Counts successful inclusion of directories.
- flag_units_that_are_included_duration Measures time taken to flag included units.
- flag_units_that_are_included_success_count Counts successful unit inclusions.
- flag_units_that_read_duration Tracks time spent flagging units that are read.
- flag_units_that_read_success_count Counts successful flagging of read units.
- hclCache_cache_get_count Tracks retrieval attempts from the HCL cache.
- hclCache_cache_hit_count Counts successful hits in the HCL cache.
- hclCache_cache_miss_count Counts misses in the HCL cache.
- hclCache_cache_put_count Tracks additions to the HCL cache.
- iamRoleCache_cache_get_count Tracks retrieval attempts from the IAM role cache.
- iamRoleCache_cache_hit_count Counts successful hits in the IAM role cache.
- iamRoleCache_cache_miss_count Counts misses in the IAM role cache.
- iamRoleCache_cache_put_count Tracks additions to the IAM role cache.
- parse_config_file_duration Measures the time taken to parse configuration files.
- parse_config_file_success_count Counts successful configuration file parsing operations.
- resolve_dependencies_for_module_duration Tracks time spent resolving dependencies for a module.
- resolve_dependencies_for_module_success_count Counts successful module dependency resolutions.
- resolve_external_dependencies_for_modules_duration Measures time taken to resolve external dependencies for modules.
- resolve_external_dependencies_for_modules_success_count Counts successful external dependency resolutions.
- resolve_modules_duration Tracks time spent resolving modules.
- resolve_modules_success_count Counts successful module resolutions.
- resolve_terraform_module_duration Measures time taken to resolve Terraform modules.
- resolve_terraform_module_success_count Counts successful Terraform module resolutions.
- run_all_duration Tracks the total duration of a 'run-all' command.
- run_all_on_stack_duration Measures the time taken to run all operations on a stack.
- run_all_on_stack_success_count Counts successful 'run-all' operations on a stack.
- run_all_success_count Counts overall successful 'run-all' operations.
- run_module_duration Tracks the time taken to run a single module.
- run_module_success_count Counts successful module runs.
- run_terraform_duration Measures the time taken to run Terraform commands.
- run_terraform_success_count Counts successful Terraform command executions.
- wait_for_module_ready_duration Tracks time spent waiting for a module to be ready.
- wait_for_module_ready_success_count Counts successful module readiness waits.
Appendix B: Dashboards from Dash0 integrations hub