Last updated: July 9, 2025
Unlocking Kubernetes Observability with the OpenTelemetry Operator
Kubernetes has transformed the way we deploy and manage applications, but it has also introduced a new level of operational complexity. As clusters scale and workloads become more distributed, understanding what’s happening under the hood is more challenging than ever. Traditional monitoring tools often fall short, providing fragmented views of logs, metrics, and traces that don’t tell the full story.
This is where OpenTelemetry comes in. By standardizing telemetry collection across multiple signals, OpenTelemetry enables powerful correlation and deeper insights. However, setting up and managing observability pipelines manually can be a daunting task.
Enter the OpenTelemetry Operator, a Kubernetes-native solution designed to simplify and automate telemetry collection. It enables engineers to observe both their Kubernetes infrastructure and the applications running on top - without spending excessive time on configuration and maintenance.
In this deep dive, we’ll explore:
- The role of Kubernetes operators in automating observability.
- Key capabilities of the OpenTelemetry Operator.
- Practical examples of Kubernetes monitoring.
- Auto-instrumentation of applications.
- Best practices for deploying the OpenTelemetry Collector.
- Addressing common questions like, “Do I still need Prometheus?”
Let’s get started!
What is an operator?
Kubernetes operators extend Kubernetes' core functionality by automating the deployment, configuration, and management of applications using custom resource definitions (CRDs). These operators encapsulate operational expertise, allowing engineers to manage applications with reduced manual effort and intervention.
The OpenTelemetry Operator leverages CRDs to manage OpenTelemetry Collectors, automate the instrumentation of applications, and streamline the processing of telemetry data pipelines. Instead of requiring manual configurations for these tasks, the operator ensures that they are integrated into your Kubernetes environment.
The OpenTelemetry Operator
The OpenTelemetry Operator manages the lifecycle of OpenTelemetry Collectors, auto-instrumentation, and telemetry pipelines, ensuring seamless data processing across the entire cluster.
One of the key functions of the OpenTelemetry Operator is managing OpenTelemetry Collectors, which are responsible for ingesting, processing, and exporting telemetry data. The operator automates the deployment and configuration of these collectors, supporting various modes such as Deployment, DaemonSet, or StatefulSet depending on the use case. For example, collectors deployed as DaemonSets can capture metrics and logs from Kubernetes nodes, while a Deployment or Statefulset-based setup is ideal for central processing.
The operator also simplifies application instrumentation by automating the injection of OpenTelemetry agents into workloads. This feature, known as auto-instrumentation, supports languages like Java, Python, Node.js, .NET, and Go. It removes the need for developers to modify application code to integrate telemetry, instead relying on pod annotations and CRD configurations to enable tracing, metrics, and logging for applications. An important thing to note about Go auto-instrumentation is that it leverages eBPF, and requires you to run a sidecar container that requires elevated privileges. More about that later.
Dynamic target allocation is another interesting feature of the OpenTelemetry Operator, particularly for organizations using Prometheus. The OpenTelemetry Operator’s Target Allocator component decouples Prometheus’ service discovery from metric scraping, distributing scrape targets evenly across collectors. This ensures scalability and prevents overloading any single collector instance. By integrating with Prometheus CRDs like ServiceMonitor, the operator bridges existing Prometheus-based setups with OpenTelemetry’s broader capabilities.
Strategies for Deploying OpenTelemetry Collectors with the Operator in Kubernetes
When collecting Kubernetes-related telemetry, it’s important to deploy OpenTelemetry Collectors in a way that optimizes data collection while avoiding duplication. Some telemetry sources, like pod logs, require a collector on every node, while others, like cluster-wide metrics, should be gathered centrally to prevent redundant data ingestion.
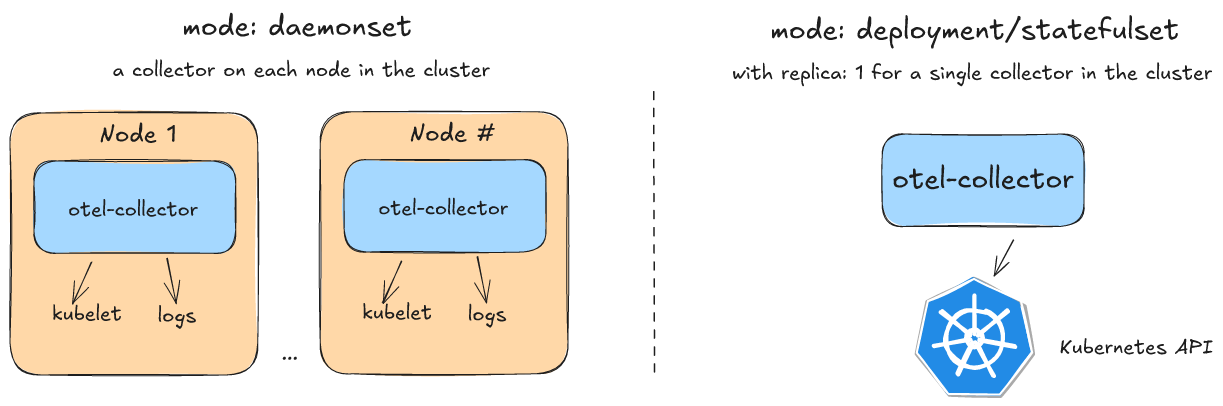
To ensure efficient observability, we recommend deploying a set of collectors on each node using a DaemonSet. These node-level collectors handle logs using the filelog receiver and gather Kubernetes metrics via the kubeletstats receiver, paired with the k8sattributes processor for enriched metadata.
Alongside this, a single-instance collector should be deployed as a Deployment or StatefulSet to capture cluster-wide telemetry. This central collector uses the k8s_cluster receiver and the kubernetes_objects receiver to aggregate high-level Kubernetes metrics. To maintain accuracy and avoid duplicate reporting, this deployment should be limited to a single replica.
While sidecar deployment has its use cases, this guide focuses on the DaemonSet, Deployment, and StatefulSet models, as they provide the best balance of efficiency and scalability for most Kubernetes observability needs.
If you’d like to explore a demo and see the configurations for deploying the OpenTelemetry Collector in the different modes, check out the following repository:
https://github.com/dash0hq/demo-otel-operator
- DaemonSet Configuration: otel-collector-daemonset.yaml
- StatefulSet Configuration: otel-collector-central.yaml
(Used here instead of a Deployment due to local issues with the TargetAllocator when running in Deployment mode.)
This repository provides a small demo environment as well as detailed examples of how to deploy the collector to capture both node-level and cluster-wide metrics.
Monitoring Kubernetes
The OpenTelemetry Collector provides various receivers to collect and process telemetry data from Kubernetes environments. By leveraging multiple receivers and processors, it's possible to gain deep insights into clusters, nodes, and workloads.
- Kubeletstats Receiver: The Kubeletstats Receiver collects node-level metrics, including CPU, memory, and disk usage, by pulling data from the Kubernetes Kubelet API. This receiver is best deployed using a DaemonSet, ensuring each node in the cluster has a local collector to minimize latency and reduce cluster-wide network overhead.
- Kubernetes Cluster Receiver: The Kubernetes Cluster Receiver gathers cluster-wide metrics such as node conditions, pod phases, resource quotas, and deployment statuses. This receiver should be deployed using a single-replica Deployment or StatefulSet to avoid duplicate data collection across multiple nodes.
- Kubernetes Objects Receiver: This receiver collects Kubernetes API server objects, such as events, namespaces, and resource quotas. Like the Cluster Receiver, it should be deployed in a single-replica Deployment or StatefulSet to avoid redundancy.
- Kubernetes Attributes Processor: The Kubernetes Attributes Processor automatically enriches telemetry data with Kubernetes metadata, such as pod names, namespaces, and labels. This metadata enhances correlation between application and infrastructure-level telemetry, enabling more insightful monitoring.
As mentioned previously, we recommend deploying the collector in two modes - one as a DaemonSet and one as a Deployment or StatefulSet. This two-pronged approach ensures that node-level metrics (via the DaemonSet) and cluster-wide metrics (via the Deployment/StatefulSet) are both captured for comprehensive monitoring. Below you see a visualization of the OpenTelemetry Collector configuration using otelbin.io.
OpenTelemetry Collector in DaemonSet mode:

OpenTelemetry Collector in Deployment/StatefulSet mode:

By separating the OpenTelemetry collector into these two modes, you utilize different Kubernetes components for data collection - enabling a robust foundation for monitoring your Kubernetes clusters and applications.
Auto-Instrumenting Applications
Manually instrumenting applications for observability can be tedious and error-prone. The OpenTelemetry Operator simplifies this through auto-instrumentation, which injects telemetry agents into your workloads automatically.
Supported languages include Java, Python, .NET, Node.js, and Go. Here’s an example on how you can auto-instrument a Java application:
1. Create an Instrumentation resource to configure the exporter and sampling:
12345678910111213apiVersion: opentelemetry.io/v1alpha1kind: Instrumentationmetadata:name: java-instrumentationnamespace: opentelemetryspec:exporter:endpoint: http://otel-collector:4318propagators:- tracecontext- baggagesampler:type: always_on
2. Add the following annotation to your deployment:
12annotations:instrumentation.opentelemetry.io/inject-java: "true"
This is the most simple way, however, you can also reference your Instrumentation resource directly by namespace/instrumentation-name.
When the application is deployed, the OpenTelemetry Operator automatically injects the OpenTelemetry Java agent in all Java processes in the pod, enabling automatic telemetry collection. You can explore the repository for examples of instrumented services across various supported languages.
Another interesting parameter to investigate is the addK8sUIDAttributes:
123spec:resource:addK8sUIDAttributes: true
It enables an optional configuration to add unique Kubernetes IDs (UIDs) of resources such as Deployments or Pods to your telemetry data. This makes it easier to correlate and troubleshoot issues in large or highly dynamic Kubernetes environments, where pods and deployments may come and go quickly. Without this parameter, your telemetry would be annotated only with names, and that is known to make queries involving grouping more difficult, as you need to encode in your queries multiple levels of grouping, because one pod name, for example, is generally not unique enough.
Another observation is that there are some platform-specific considerations: .NET services require additional parameters when the container images are based on Alpine Linux, and are not compatible with Mac Silicon. Go instrumentation relies on eBPF, which introduces security trade-offs. If you’d like to learn more about Go instrumentation and its implications, refer to this blog post.
This approach allows platform teams to make it easy for developers to integrate observability with minimal effort. However, for more granular telemetry data, developers may need to manually define additional telemetry in their application code using the OpenTelemetry SDK.
Target Allocator: Prometheus-Like Capabilities Without Prometheus
One of the challenges in scaling Prometheus-based monitoring in Kubernetes is distributing scrape targets across multiple Prometheus instances while ensuring optimal performance. The OpenTelemetry Operator solves this with the Target Allocator, which dynamically assigns scrape targets to OpenTelemetry Collectors, eliminating the need for a full-fledged Prometheus deployment.
The Target Allocator works by leveraging the Prometheus service discovery mechanism while offloading the actual scraping process to multiple OpenTelemetry Collectors. This allows for a more distributed and scalable approach to metric collection, reducing bottlenecks and ensuring efficient load balancing across collectors. It also enables teams to retain Prometheus’ scraping model without needing to run Prometheus itself.
Furthermore, the Target Allocator supports Prometheus Operator custom resources, meaning teams can define ServiceMonitor and PodMonitor resources in their clusters. This allows for seamless integration with Kubernetes services and pods, ensuring a familiar monitoring workflow for organizations accustomed to Prometheus. However, these CRDs are not included by default and must be installed separately, for example, via the official Helm chart:
This approach ensures that organizations transitioning from Prometheus can continue leveraging their existing monitoring configurations while gradually adopting OpenTelemetry’s more flexible telemetry model.
So, Do You Need Prometheus?
With OpenTelemetry’s evolving capabilities, a common question arises: is Prometheus still necessary? The answer depends on your use case.
For organizations that have built extensive monitoring infrastructures around Prometheus, it may not be practical to completely replace it. Instead, OpenTelemetry can complement existing Prometheus deployments by integrating the Target Allocator and using OpenTelemetry Collectors to handle telemetry aggregation, reducing the strain on Prometheus instances.
However, for new deployments or teams looking to simplify their monitoring stack, OpenTelemetry provides a compelling alternative. By using OpenTelemetry Collectors for scraping, processing, and exporting metrics, organizations can choose to eliminate prometheus entirely, or still use it as a metrics storage, while still leveraging the powerful service discovery and metric collection capabilities previously associated with it.
Ultimately, whether you need Prometheus comes down to how integrated it is with your existing workflows and how you wish to store your metrics.
Try it out in Dash0 with the OpenTelemetry Operator Integration
Dash0 provides robust visualization, analysis, and debugging tools for OpenTelemetry data. The Dash0 Integration Hub includes a comprehensive guide on setting up the OpenTelemetry Operator for efficient data collection, which can be found under the Kubernetes section.
To simplify Kubernetes observability, we’ve optimized the OpenTelemetry Collector configurations, ensuring a solid foundation out of the box. The best part? Data collection and naming adhere to OpenTelemetry's semantic conventions, allowing you to seamlessly leverage features like Dash0’s Kubernetes view for Pods for deeper insights.

Or insights into your Kubernetes nodes:

And with the auto-instrumentation feature discussed earlier in this post, you get tracing, but also logs and metrics out of the box (for some of the languages).
All in all, it’s a pretty seamless experience. With the OpenTelemetry Operator, you gain a strong foundation for Kubernetes observability, making it easier to collect, process, and analyze telemetry data with minimal effort.
Final Words
The OpenTelemetry Operator is a major advancement for Kubernetes observability, providing a Kubernetes-native way to manage collectors, automate workload instrumentation, and streamline telemetry pipelines. By reducing operational complexity and accelerating insight generation, it enables engineers to focus on what matters - understanding and optimizing their systems.
That said, while the Operator is powerful, it’s not without its limitations. Advanced configurations may require deeper knowledge of OpenTelemetry Collector components, and some Prometheus-specific features are not yet fully replicated. Additionally, auto-instrumentation, especially for languages like Go, still requires extra setup, such as eBPF agents and comes with security trade-offs.
Despite these challenges, the OpenTelemetry Operator paints a promising future where engineers can instrument applications with minimal effort and without modifying application code. Whether you're setting up Kubernetes monitoring, leveraging auto-instrumentation, or visualizing telemetry in Dash0, the Operator provides a flexible and scalable foundation for observability.
Are you ready to take your Kubernetes monitoring to the next level? Start exploring the OpenTelemetry Operator today!
Check out this repository to get up and running with the OpenTelemetry Operator locally on a kind cluster.
Consider the Dash0 Kubernetes Operator for enhanced capabilities
While the OpenTelemetry Operator provides a powerful foundation for Kubernetes observability, some organizations may find certain limitations in its feature set. If you are looking for an enhanced solution that simplifies setup while addressing gaps in auto-instrumentation and metric collection, the Dash0 Kubernetes Operator may be worth exploring.
The Dash0 Operator builds upon many of the same technologies as the OpenTelemetry Operator, but it focuses on offering out-of-the-box telemetry collection with minimal configuration. It simplifies observability by pre-configuring OpenTelemetry Collectors, handling authentication with Dash0’s backend, and providing deeper integration for supported runtimes. In addition to automatic log collection and Kubernetes metrics, the Dash0 Operator extends its capabilities by supporting PersesDashboard and PrometheusRule resources, enabling a Monitoring-as-Code approach.
With support for PersesDashboard, teams can define and manage dashboards as code, ensuring consistent visualization of metrics across environments. Meanwhile, PrometheusRule integration allows teams to create and manage alerting rules directly within Kubernetes, ensuring that monitoring and alerting configurations are version-controlled and seamlessly integrated into CI/CD workflows.
For teams looking for an easier way to get started with OpenTelemetry while benefiting from extended capabilities, the Dash0 Kubernetes Operator provides a turnkey solution for collecting, managing, and visualizing telemetry data. Learn more about the Dash0 Kubernetes Operator and how it enhances OpenTelemetry observability: Dash0 Kubernetes Operator Documentation.
