

At Dash0 we are 100% committed to the OpenTelemetry standard and are building an observability platform that will be OpenTelemetry-native. We have released an article outlining our view on what OpenTelemetry-native means. To summarize, we think those 11 points are defining OpenTelemetry-native:
- Full support of all OpenTelemetry signals (Logs, Metrics, Traces)
- Contextualize those signals with OpenTelemetry Semantic convention-based attributes
- Automated Quality Control for telemetry metadata
- Resource centricity
- Seamless integration with the cloud-native ecosystem
- One open query language for all signals
- Health and alerting system
- Sampling, data control, and scale
- One-click comparison of signals across resources and timeframes
- Fully integrated Real-User-Monitoring (RUM)
- Export and import OTLP
So to compare OpenTelemetry-native with tools that support and integrate OpenTelemetry, let’s quickly define the difference between those.
OpenTelemetry-Native
In observability, being OpenTelemetry-native means that an observability tool or platform is fundamentally designed with OpenTelemetry as its fundamental data model and architecture. Being native allows for seamless support of OpenTelemetry terminology, its protocols, and data types, eliminating the need for additional adapters or bridges. Moreover, the data source is directly mapped to the information users can access, ensuring that all OpenTelemetry signals and concepts are fully supported, providing a comprehensive and intuitive understanding of the data.
OpenTelemetry Integration
Integrating OpenTelemetry into a system, platform, or application not initially designed for it requires incorporating support for OpenTelemetry. This typically entails using OpenTelemetry agents, SDKs, or libraries to instrument parts of the observed applications and map the OpenTelemetry data model to an internal model employed by the observability vendor for their proprietary agents and data collection technologies.
Consistent use of OpenTelemetry Terminology
We believe that an OpenTelemetry-native solution embraces all of OpenTelemetry. And that starts quite simply with the terminology and its consistent use. Here are just some examples of the standardized
- Key/value pairs carrying metadata associated with resources or signals are called attributes – not tags or labels.
- Spans form traces – not transactions.
- Spans record information about operations.
- …and more.
These points may seem pedantic. However, thanks to OpenTelemetry's SDKs and general dominance, developers are more exposed than ever to its terminology. They should not have to translate/juggle between two different terminology sets when inspecting their collected data.
Contextualization and Resource-centricity
One key element of OpenTelemetry is the context it generates for all signals, using the semantic convention for attributes. Context makes telemetry data usable and understandable for the user.

As an example, when we look at an OpenTelemetry Log in Dash0, the user sees not only the log data and associated attributes but also the context of the Span that actually created that log. This way, there is a direct association between the log and the service code that generated it. The developer can now deep-dive into the trace with one click to get more information about why and in which context the log has been generated.
At the same time, it also shows the resource on which the log was generated. Resources form an implicit powerful context that is almost always available. In this case, we can see that the log record was generated in a Java process of the AdService that was running within a Kubernetes namespace called otel-demo and Kubernetes Deployment opentelemetry-demo-adservice in availability zone eu-west-1a inside AWS. Clicking on any of those resources will give you all the needed information of it to understand the context of the log in detail.
All that context is powered by OpenTelemetry data without the need of proprietary agents or technology. As the data is interconnected, it can also be used to filter and search based on the semantical attributes and resources:
- Show me all logs and spans of a specific Pod or service
- Compare the traffic of one availability zone with another one
- As part of which HTTP request are we logging this warning?
It is a powerful tool for troubleshooting and analytics of telemetry data and also the foundation for more sophisticated analytics functionality that can rely on the semantic information that is attached to the signals.
Semantic Filtering
One critical use case is triaging and filtering data based on the content and attributes we briefly described before.
You can effortlessly filter spans with a single click by leveraging semantic information as context.
In the above example, we initially filtered all spans with an HTTP operation type to focus on HTTP request spans. Dash0 conveniently highlights the most relevant attributes along with the span's name. We specified that we wanted to exclude HTTP calls with a status code of 200 OK. Consequently, we swiftly identified all HTTP requests that resulted in non-OK responses.
Through two quick filter clicks, staying in the context of the span table, we reduced the number of spans from 628k to 14k, enabling us to dive deeper by filtering based on more specific attributes.
In contrast, non-OpenTelemetry-native tools do not utilize the semantics of attributes. As a result, attributes are merely text key-value pairs rather than actionable information and filters.

Elastic is showing text-based key/value pairs, not even formatting based on type.

Grafana shows span attributes as key/value pairs without any semantics or actions—at least incorporating the type for formatting.
Resource Filtering
Using the resource concept of OpenTelemetry to connect signals and provide context also enables some unique usability features. For example, you can create a structure of your resources based on different perspectives (attribute combinations and hierarchies).

The screenshot shows all the concepts in one view. On the left side, we see Dash0’s resource explorer showing the structure of the deployed application from different perspectives, like a Service Perspective or a Kubernetes perspective that shows exactly where the AdService is deployed in terms of namespaces, nodes, and how many Pods it is running (in this case, 3 instances in 3 pods).
It aggregates the key metrics for the service in a table and shows all the telemetry data, like spans and logs, associated with the service. So everything is just a click or keyboard shortcut away.
When things are not connected like in an OpenTelemetry-native tool, you can have situations where you want to see a metric of a GKE host but AWS metrics are selectable though not available for the resource:

In contrast to an OpenTelemetry Resource-centric metric exploration of Dash0:
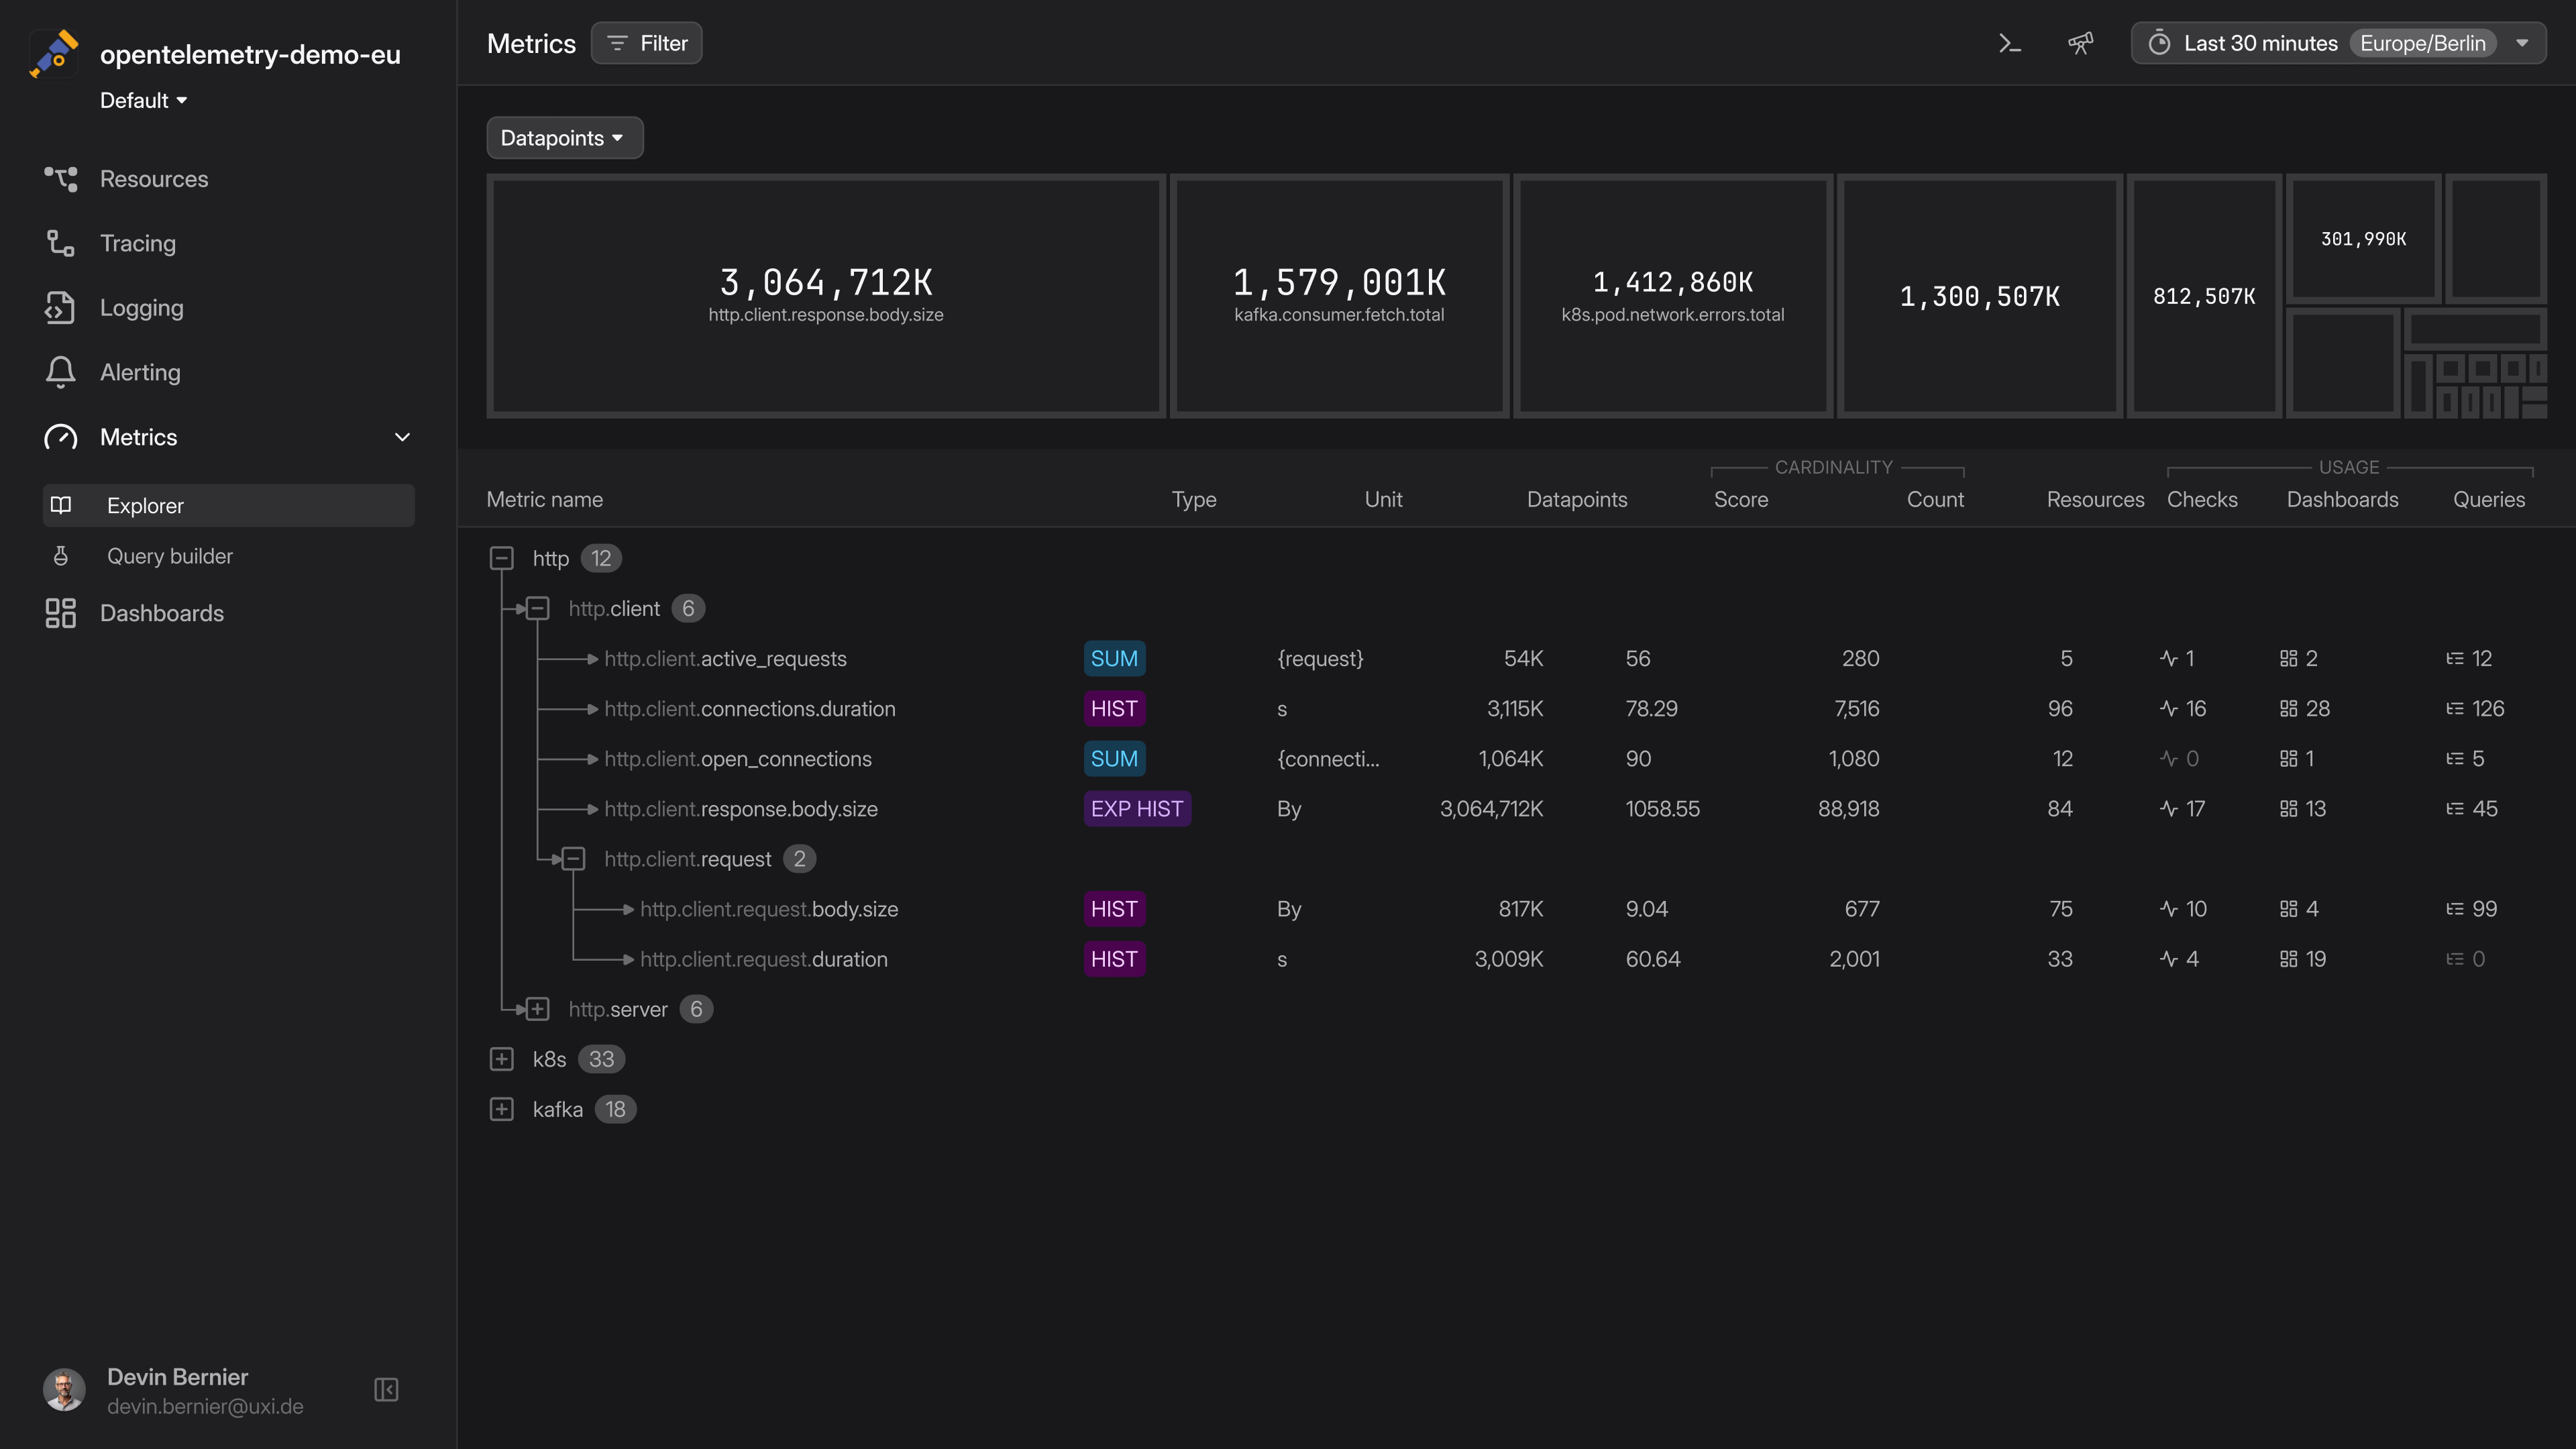
This is because tools like Elastic or Grafana do not use the resource context to filter the metrics down to the ones with the relevant, selected tags from the semantic convention.
Having the resource's context incorporated in the data model helps to quickly navigate all the relevant data in the rights context but also automatically filters out signals that are not available for that resource.
See OTLP Raw data
Sometimes, things go wrong, and the data shown in the tool is not what you would have expected as a developer, platform engineer, or SRE. This is when OpenTelemetry-native tools come to the rescue because they keep the data exactly in the format they were injected: OTLP.

Dash0 includes a source tab for all signals, allowing users to view, search, and filter raw OTLP data like an IDE or Debugger. This tab simplifies understanding the mapping of telemetry data to Kubernetes clusters, the absence of HTTP span attributes, or clock skew between hosts and processes. Additionally, the data can be exported as JSON for further analysis in external tools or validation purposes.
Conclusion
Using OpenTelemetry as your primary telemetry data source offers significant benefits when paired with an OpenTelemetry-native observability platform. This platform can provide context and support based on the rich, standardized data that OpenTelemetry provides.
It allows users to see the telemetry data in the context of the underlying resources on which they were produced, with easy navigation and filtering to quickly identify relevant problems.
Integrating OpenTelemetry can also be advantageous if you're utilizing proprietary technology and want to incorporate OpenTelemetry additionally. However, the OTel data will be converted into the vendor's internal model and data format in this scenario. This conversion process may result in losing some OpenTelemetry features related to context and information. Despite this, you can still utilize third-party OTel data if needed.

