Introduction to Debug: Minimalist Logging for Node.js Development
In the Node.js ecosystem, sometimes the simplest solutions are the most effective. Debug has emerged as a favorite lightweight debugging utility, offering just enough functionality without the complexity of full-featured logging frameworks. Its focused approach to development-time logging has made it an essential tool in countless Node.js projects.
Why Debug Has Become a Developer Favorite
Debug has earned its place in the Node.js toolkit for several compelling reasons:
- Environment Variable Control: Enable/disable debug output selectively via environment variables
- Namespace Support: Organize debug statements with hierarchical namespaces
- Visual Differentiation: Automatic color-coding for different namespaces
- Minimal Overhead: Extremely lightweight with zero dependencies
- Browser Compatibility: Works in both Node.js and browser environments
- Production-Ready: Disabled by default in production for zero performance impact
Getting Started with Debug
Installation is simple with npm:
1npm install debug
Basic usage requires minimal code:
123456789101112131415const debug = require('debug')('app:main');// This won't show unless DEBUG env var is setdebug('Application starting');// Create namespace-specific debuggersconst dbDebug = require('debug')('app:db');const authDebug = require('debug')('app:auth');dbDebug('Connected to database');authDebug('User authenticated');// Enable with: DEBUG=app:* node app.js// Or selectively: DEBUG=app:db,app:auth node app.js
Elevating Debug with OpenTelemetry for Comprehensive Observability
While Debug is perfect for development-time logging, modern applications benefit from a more integrated approach to observability. By combining Debug with an OpenTelemetry-native observability platform, you can transform these development insights into components of a unified monitoring strategy.
This powerful integration enables:
- Development-to-Production Continuity: Maintain the same logging approach across environments
- Trace Context Enrichment: Add trace and span IDs to debug statements automatically
- Unified Telemetry: View debug outputs alongside metrics and traces
- Selective Enabling: Continue using environment variables for control while capturing data
- Contextual Troubleshooting: Link debug statements to specific traces for faster problem resolution
Implementing Debug with OpenTelemetry
Setting up the integration is straightforward:
12345678910111213141516171819202122232425262728293031const opentelemetry = require('@opentelemetry/api');const { NodeTracerProvider } = require('@opentelemetry/sdk-trace-node');// Initialize OpenTelemetryconst provider = new NodeTracerProvider();provider.register();// Create a tracerconst tracer = opentelemetry.trace.getTracer('example-app');// Set up debug with OpenTelemetry contextconst debug = require('debug')('app:main');// Create a wrapper function that adds trace contextfunction tracedDebug(message) {const span = opentelemetry.trace.getSpan(opentelemetry.context.active());if (span) {const traceId = span.spanContext().traceId;debug(`[trace: ${traceId}] ${message}`);} else {debug(message);}}// Use the enhanced debug functiontracer.startActiveSpan('operation', span => {tracedDebug('This debug statement has trace context');span.end();});
Analyzing OpenTelemetry Logs in Dash0
Logs can be directly routed into Dash0. Dash0 with OpenTelemetry provides the ability to filter, search, group, and triage within a simple user interface, with full keyboard support. Dash0 also gives full log context by showing trace context, the call and resource that created the log - including details like the Kubernetes Pod, server, and cloud environment.
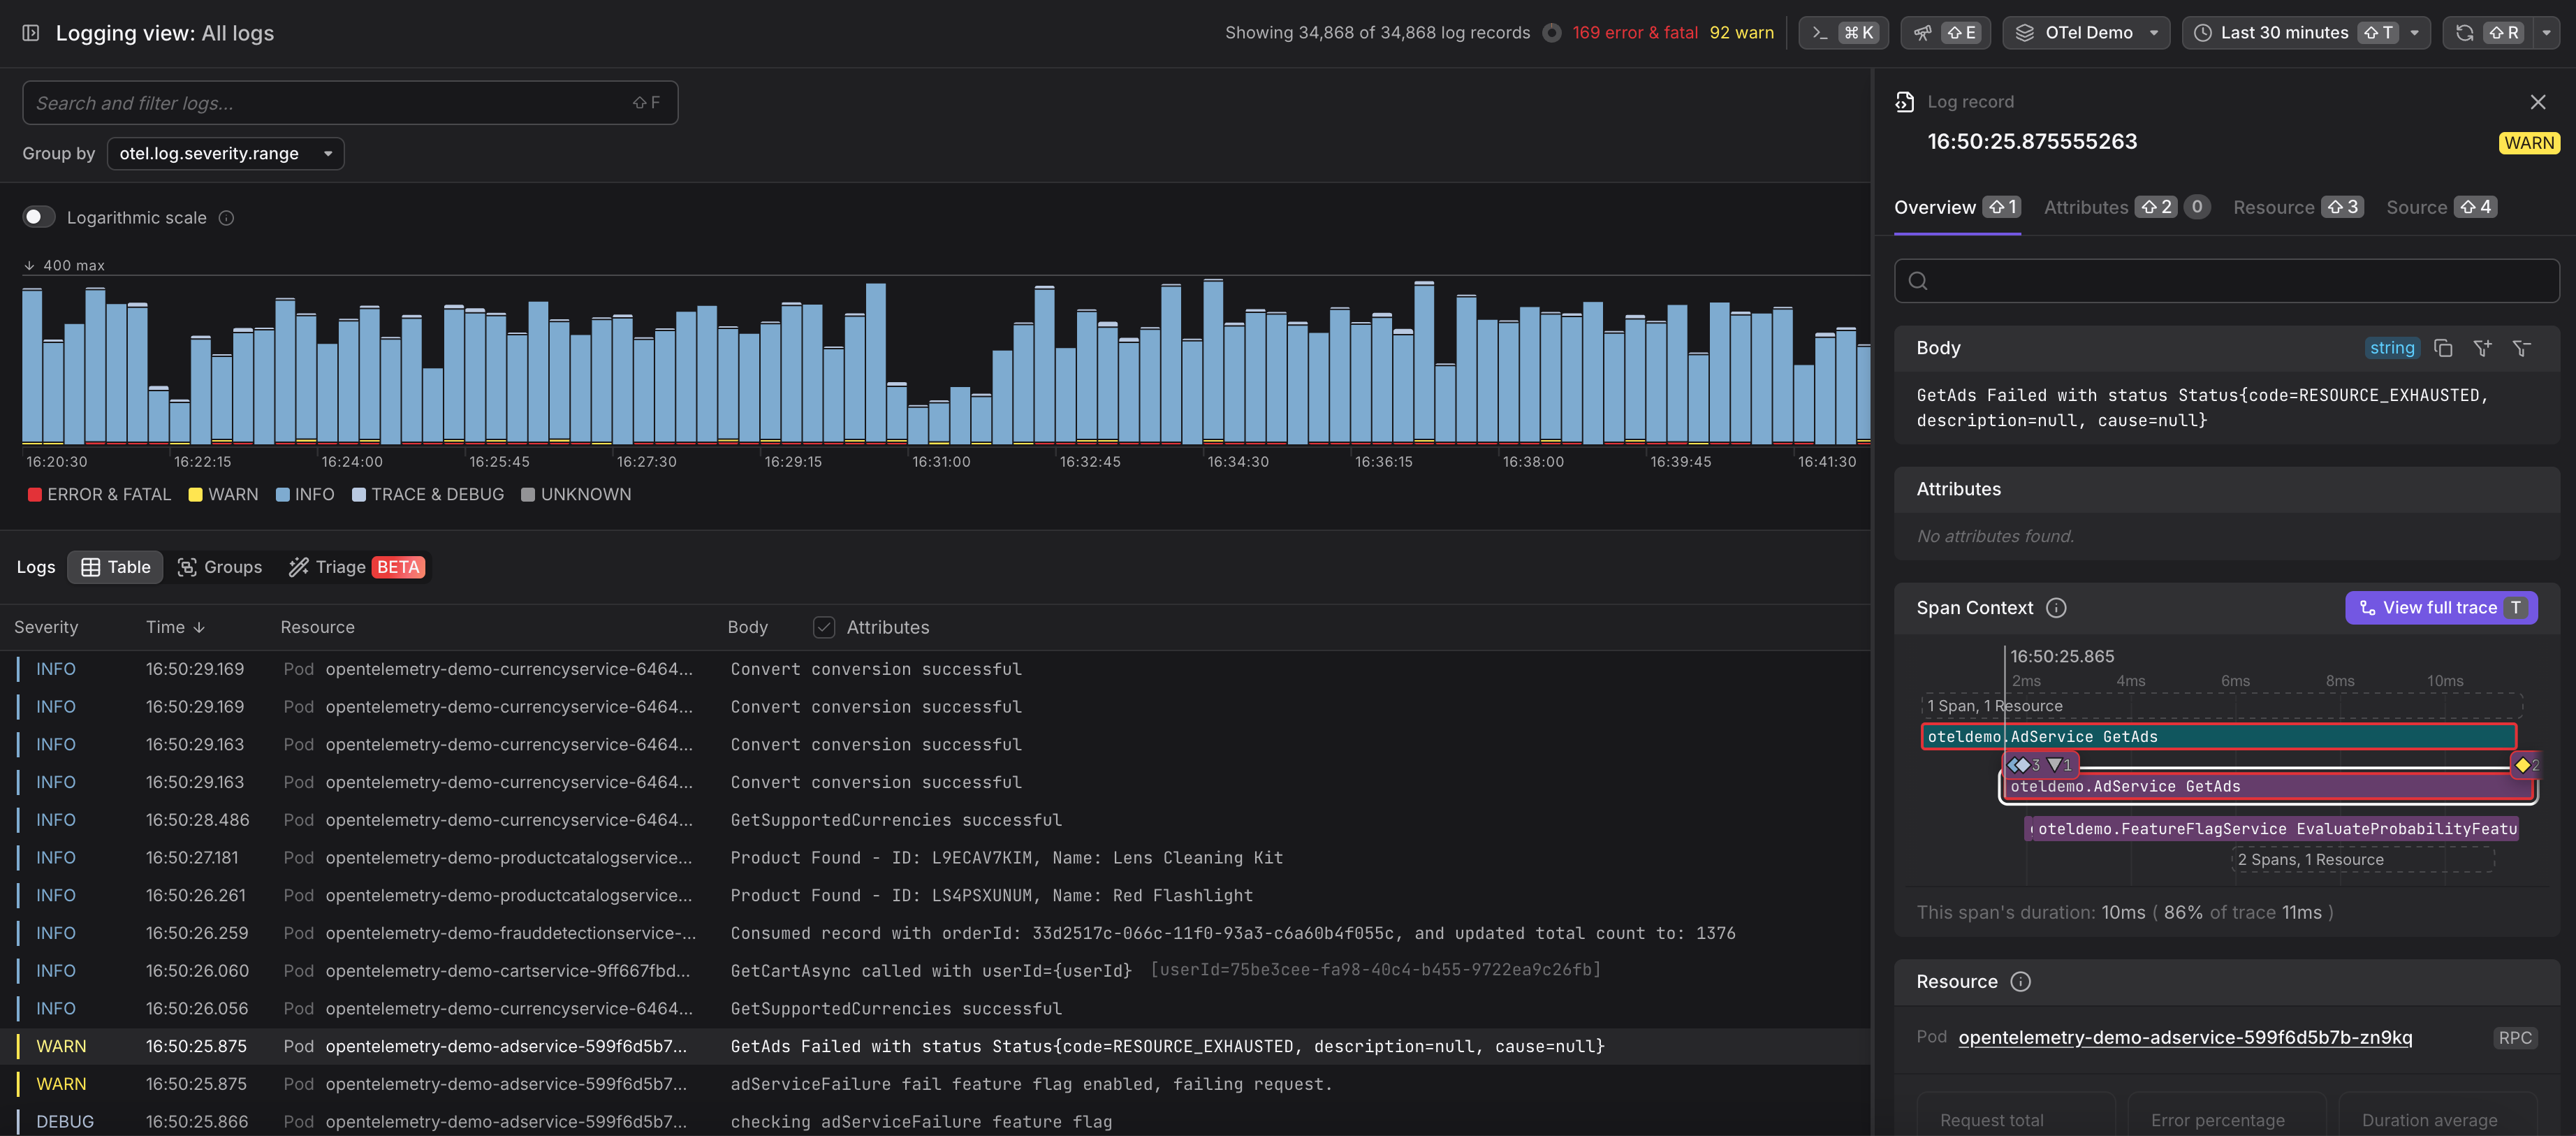
Log AI also enhanced the logs with more semantical metadata and structure without any manual pattern declaration.
Conclusion
In 2025, Debug continues to be a developer favorite for lightweight, flexible logging during development. Its minimalist approach and environment variable control make it perfect for targeted debugging without the overhead of more complex solutions.
By enhancing Debug with OpenTelemetry integration, developers can maintain this lightweight approach while gaining the benefits of unified observability. This combination delivers powerful insights by connecting debug statements with traces and metrics, enabling faster problem resolution without sacrificing the simplicity that makes Debug so popular.
For Node.js applications that need both development-time debugging and the ability to correlate these insights with production monitoring, Debug with OpenTelemetry integration offers an ideal solution that scales with your development process.