What is Logback?
Logback stands as the natural successor to the popular Log4j framework, designed by the same creator, Ceki Gülcü. As a reliable, flexible, and high-performance logging framework for Java applications, Logback natively implements the SLF4J API, providing a seamless experience for developers seeking robust logging capabilities.
Why Logback Outperforms Other Logging Frameworks
Logback has gained widespread adoption among Java developers for several compelling reasons:
- Superior Performance: Engineered for speed with optimized filtering capabilities and faster implementation compared to Log4j 1.x.
- Automatic Reloading: Reconfigures itself when the configuration file changes without requiring application restarts.
- Graceful Recovery: Automatically recovers from configuration errors without crashing your application.
- Native SLF4J Implementation: Provides direct implementation of the SLF4J API without adaptation layers that could impact performance.
- Advanced Filtering: Offers sophisticated evaluation conditions for determining which log events to process.
- Prudent Mode: Supports safe logging from multiple JVMs to the same file.
- Conditional Processing: Enables environment-specific configuration sections for different deployment environments.
Core Components of Logback
Logback's architecture consists of three main modules:
- logback-core: The foundation upon which the other modules are built.
- logback-classic: Implements the SLF4J API, providing the core logging functionality.
- logback-access: Integrates with Servlet containers like Tomcat and Jetty for HTTP-access logging.
Getting Started with Logback
To implement Logback in your Java application, add the following Maven dependencies:
12345678<dependencies><dependency><groupId>ch.qos.logback</groupId><artifactId>logback-classic</artifactId><version>1.4.11</version></dependency><!-- SLF4J API is included as a transitive dependency --></dependencies>
A basic Logback configuration file (logback.xml) might look like this:
12345678910111213141516171819202122<configuration><appender name="CONSOLE" class="ch.qos.logback.core.ConsoleAppender"><encoder><pattern>%d{HH:mm:ss.SSS} [%thread] %-5level %logger{36} - %msg%n</pattern></encoder></appender><appender name="FILE" class="ch.qos.logback.core.rolling.RollingFileAppender"><file>logs/application.log</file><rollingPolicy class="ch.qos.logback.core.rolling.TimeBasedRollingPolicy"><fileNamePattern>logs/application.%d{yyyy-MM-dd}.log</fileNamePattern><maxHistory>30</maxHistory></rollingPolicy><encoder><pattern>%d{yyyy-MM-dd HH:mm:ss.SSS} [%thread] %-5level %logger{36} - %msg%n</pattern></encoder></appender><root level="INFO"><appender-ref ref="CONSOLE" /><appender-ref ref="FILE" /></root></configuration>
Enhancing Logback with OpenTelemetry Observability
While Logback provides excellent logging capabilities, modern application environments demand comprehensive observability solutions. Our OpenTelemetry native observability platform seamlessly integrates with Logback to transform traditional logging into a core component of your overall telemetry strategy.
Key benefits of integrating Logback with our OpenTelemetry solution include:
- Trace-Aware Logging: Automatically correlate logs with distributed traces across your microservices architecture without code changes.
- Contextual Enrichment: Enhance log entries with OpenTelemetry context, service metadata, and custom attributes for more meaningful analysis.
- Centralized Log Management: Stream Logback logs directly to our unified observability platform alongside metrics and traces.
- Intelligent Log Analysis: Apply machine learning algorithms to identify patterns and anomalies across your log data.
- Real-Time Alerting: Configure alerts based on sophisticated log patterns and thresholds integrated with your overall monitoring strategy.
Integration requires minimal configuration changes through our specialized Logback appender that preserves your existing logging patterns while adding OpenTelemetry capabilities:
12345<appender name="OTEL" class="com.example.logback.OpenTelemetryAppender"><encoder><pattern>%d{HH:mm:ss.SSS} [%thread] %-5level %logger{36} - %msg%n</pattern></encoder></appender>
Analyzing OpenTelemetry Logs in Dash0
Logs can be directly routed into Dash0. Dash0 with OpenTelemetry provides the ability to filter, search, group, and triage within a simple user interface, with full keyboard support. Dash0 also gives full log context by showing trace context, the call and resource that created the log - including details like the Kubernetes Pod, server, and cloud environment.
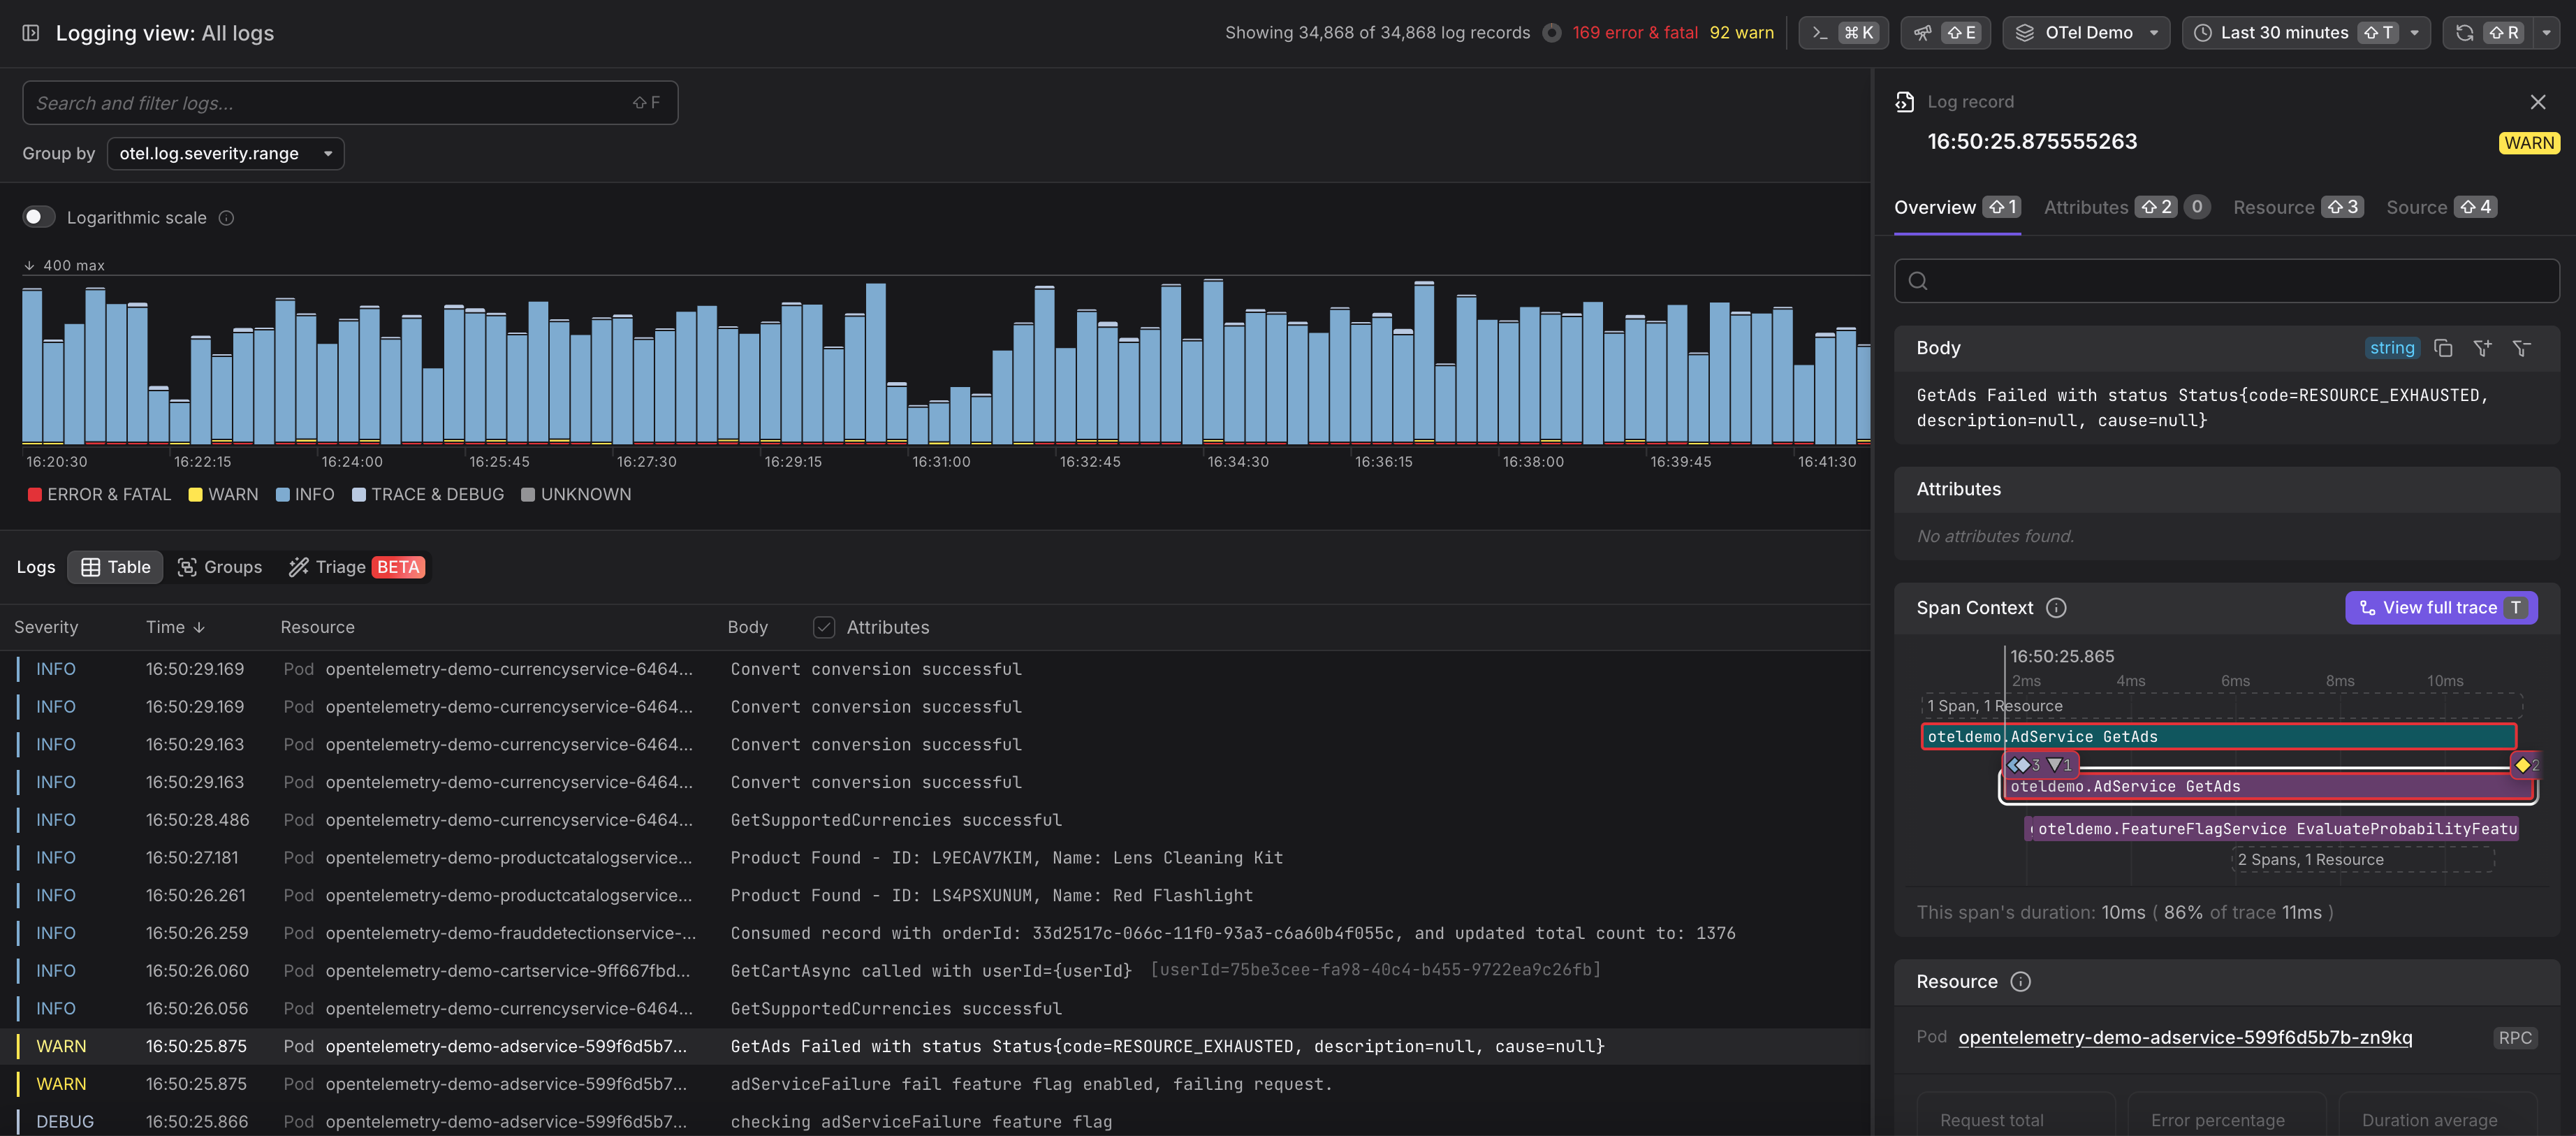
Log AI also enhanced the logs with more semantical metadata and structure without any manual pattern declaration.
Conclusion
Logback represents the gold standard for Java logging implementations, combining flexibility, reliability, and performance. By enhancing Logback with our OpenTelemetry native observability solution, you transform isolated log data into contextualized telemetry that provides unprecedented visibility into your application behavior.
Whether you're managing enterprise applications, microservices architectures, or cloud-native deployments, the combination of Logback and OpenTelemetry delivers the comprehensive observability needed to maintain reliability, troubleshoot effectively, and continuously optimize your Java applications.