Last updated: July 6, 2025
Production-Grade Logging in Node.js with Pino
A good logging system helps you troubleshoot issues, and gain insights into how your applications are behaving in production. For Node.js applications, Pino is widely recognized as one of the fastest and most efficient logging libraries available.
Pino, which means "pine tree" in Italian, lives up to its name by being lean and exceptionally fast. Its JSON output makes it ideal for modern logging systems and observability platforms.
In this comprehensive guide, we'll explore Pino's core features, demonstrate how to integrate it with popular Node.js frameworks, and show how to leverage its capabilities for effective, structured logging.
I’ll also cover how to align Pino with OpenTelemetry standards to enable seamless observability and correlation across logs, traces, and metrics.
Introducing Pino
Since its introduction in 2014, Pino has gained widespread adoption thanks to its fast execution, flexible configuration, and compatibility with modern observability tools. Its reputation for performance even led to it becoming the default logger for the Fastify web framework.
Let’s begin by looking at a basic example of Pino in action. Before you can use Pino in your project, you’ll need to install it first:
1npm install pino
Once installed, you can import it and set up a logger instance like this:
1234import pino from "pino";const logger = pino();logger.info("A log message");
Executing this program will produce the following structured JSON output:
1234567{"level": 30,"time": 1746617936285,"pid": 11187,"hostname": "Falcon","msg": "A log message"}
This example demonstrates Pino’s default log format, with each log entry containing the following fields:
- A numeric level indicating severity (30 = info).
- A UNIX timestamp (in milliseconds).
- The process ID of the Node.js runtime.
- The hostname of the machine running the app.
- The actual log message.
This structured format is great for machines and log aggregation systems, but it can be less readable during development.
For a more developer-friendly output, you can use pino-pretty, which formats and colorizes logs for easy reading:
1npm install --save-dev pino-pretty
Once installed, you can pipe the output of your Node.js program through the pino-pretty command:
1node index.js | npx pino-pretty
You’ll see a cleaner, colorized output that is much more human-readable:

You can customize this output extensively if you wish. See the output of pino-pretty --help to learn more:

For the remainder of this article, we’ll stick with the JSON format, since it’s better suited for discussing how Pino integrates with observability tooling and telemetry pipelines.
Configuring Pino log levels
Pino supports a set of standard log levels, each associated with a numeric value that reflects its severity.
Unlike Winston, Pino uses a smaller number to indicate a lower severity, while a larger number indicates a higher severity. This aligns with common conventions where higher numbers often represent more critical states.
The default log levels, in order of increasing severity, are:
trace(10): Highly detailed messages, often used for following program execution flow.debug(20): Diagnostic information useful for debugging.info(30): General informational messages about the application’s operation.warn(40): Indicates potential issues or unusual situations that are not critical errors.error(50): For error conditions that prevent normal operation or signify a failure.fatal(60): Critical errors where the application or a significant component becomes unusable.
Pino provides corresponding methods on the logger instance for convenience:
123456logger.trace("A trace message");logger.debug("A debug message");logger.info("An info message");logger.warn("A warn message");logger.error("An error message");logger.fatal("A fatal message");
With the default configuration, only messages with a severity of info or higher are logged. This means that calls to trace() and debug() will be ignored unless the log level is explicitly lowered. Here’s an example of the output:
1234{"level":30,"time":1746627220916,"pid":17145,"hostname":"Falcon","msg":"An info message"}{"level":40,"time":1746627220916,"pid":17145,"hostname":"Falcon","msg":"A warn message"}{"level":50,"time":1746627220916,"pid":17145,"hostname":"Falcon","msg":"An error message"}{"level":60,"time":1746627220916,"pid":17145,"hostname":"Falcon","msg":"A fatal message"}
You can configure Pino to use a different default level by setting the level option:
12345import pino from "pino";const logger = pino({level: process.env.LOG_LEVEL || "info",});
This makes it easy to control logging verbosity via an environment variable. For example, with LOG_LEVEL=error, only error and fatal messages will be emitted:
1LOG_LEVEL=error node index.js
12{"level":50,"time":1746628518983,"pid":17909,"hostname":"Falcon","msg":"An error message"}{"level":60,"time":1746628518983,"pid":17909,"hostname":"Falcon","msg":"A fatal message"}
To disable logging entirely, you can set the level to silent:
1LOG_LEVEL=silent node index.js
Outputting Pino’s log levels as strings
Although Pino defaults to a numeric representation log levels, those numbers mean nothing outside Pino's system.
For better integration with the broader observability ecosystem, it's a better practice to configure Pino to output the level as a string so that parsing and filtering logs is much more intuitive.
You can do this using the formatters.level() function:
12345678const logger = pino({level: process.env.LOG_LEVEL || "info",formatters: {level(label) {return { level: label }; // This returns { level: 'info' } instead of { level: 30 }},},});
This outputs the log level as a string:
12{"level":"info","time":1746629118489,"pid":18290,"hostname":"Falcon","msg":"An info message"}{"level":"warn","time":1746629118489,"pid":18290,"hostname":"Falcon","msg":"A warn message"}
Later in this article, you'll learn how to integrate Pino with OpenTelemetry’s log data model which uses SeverityNumber and SeverityText to designate log severity for better interoperability across diverse logging systems.
Setting up custom log levels in Pino
Pino also allows you to define your own custom set of severity levels by providing a customLevels object during logger creation.
Here’s an example:
12345678910111213const customLevels = {verbose: 15,critical: 55,};const logger = pino({customLevels: customLevels,useOnlyCustomLevels: false, // Set to true if you only want to use your custom levels});logger.verbose("a very verbose message");logger.info("an info message"); // Default info level (30) is still availablelogger.critical("a critical system alert");
Each key in the customLevels object becomes a log level name (and a corresponding method on the logger), and its value is the integer representing its priority. Just remember that higher numbers mean higher severity in Pino.
Adjusting Pino's default log fields
Pino's default log structure provides a solid foundation, but you can tailor it to better suit your application’s requirements by modifying or extending the fields it includes.
You’ve already seen how to customize the level field, but you can also adjust the time field format or even rename it.
Pino offers several built-in functions under pino.stdTimeFunctions for formatting timestamps:
pino.stdTimeFunctions.epochTime: Milliseconds since Unix epoch (Default)pino.stdTimeFunctions.unixTime: Seconds since Unix epoch.pino.stdTimeFunctions.isoTime: ISO 8601-formatted time in UTC.
For example, to change the time to ISO 8601, you can use the timestamp option:
123const logger = pino({timestamp: pino.stdTimeFunctions.isoTime,});
This will produce output like:
1234567{"level": 30,"time": "2025-05-07T16:42:38.849Z","pid": 20350,"hostname": "Falcon","msg": "An info message"}
If you’d like to rename the time field, you can use a custom function like this:
123const logger = pino({timestamp: () => `,"timeUnixNano":${BigInt(Date.now()) * 1_000_000n}`,});
This outputs:
1234567{"level": 30,"timeUnixNano": 1746638868087000000,"pid": 21305,"hostname": "Falcon","msg": "An info message"}
Customizing the default bindings
You’ve also seen that Pino includes the process ID (pid) and hostname in each log entry. These are defined in the logger’s bindings and can be customized using the formatters.bindings option.
To retain just the defaults:
1234567const logger = pino({formatters: {bindings: ({ pid, hostname }) => {return { pid, hostname };},},});
If you want to remove these fields (e.g. because they’re redundant or handled by your infrastructure), you can do so in two ways:
123const logger = pino({base: null, // Removes pid and hostname});
Or:
12345const logger = pino({formatters: {bindings: () => {}, // Omits bindings entirely},});
If you need to add global metadata to all your logs, you only need to customize the return value of formatters.bindings. For example, here’s how to include your application’s version number in all logs:
123456789import packageJson from "./package.json" with { type: "json" };const logger = pino({formatters: {bindings: () => {return { version: packageJson.version };},},});
This results in:
123456{"level": 30,"time": 1746640463128,"version": "1.0.0","msg": "An info message"}
This technique is useful for enriching logs with global metadata like service name, environment, region, or deployment identifiers, making it easier to correlate entries in distributed systems.
Capturing event and error details
Contextual logging is the practice of enriching log entries with additional details relevant to the event being recorded. These properties make your logs far more useful, especially when searching, filtering, or debugging.
For instance, when handling an HTTP request, it’s helpful to include details like the HTTP method, request path, and response status.
Here’s how to log that context using Pino, and using property names that are compliant with OpenTelemetry Semantic Conventions:
12345678910111213141516app.use((req, res, next) => {res.on("finish", () => {const url = new URL(`${req.protocol}://${req.get("host")}${req.originalUrl}`,);logger.info({"http.request.method": req.method,"url.full": url,"http.response.status_code": res.statusCode,},"HTTP request completed", // The log message);});next();});
Pino uses an optional mergingObject argument on each log method to support contextual log entries, and you can then provide the log message in the second argument.
This produces entries that include all relevant request metadata, allowing you to filter them by any attribute in your observability platform:
12345678910{"level": 30,"time": 1746641621841,"pid": 23981,"hostname": "Falcon","http.request.method": "GET","url.full": "http://localhost:3000/","http.response.status_code": 200,"msg": "incoming HTTP request"}

Logging Node.js errors with context
When an error occurs, you can pass the error object as the first argument to a log method. Pino will automatically serialize it and include the message, type, and stack trace in the log output.
12345try {throw new Error("something happened!");} catch (err) {logger.error(err, "operation failed");}
This results in a structured error log that looks like this:
123456789101112{"level": 50,"time": 1746642329823,"pid": 24497,"hostname": "Falcon","err": {"type": "Error","message": "something happened!","stack": "Error: something happened!\n at file:///home/ayo/dev/dash0/demo/pinojs-logging/index.js:35:8\n at ModuleJob.run (node:internal/modules/esm/module_job:274:25)\n at async onImport.tracePromise.__proto__ (node:internal/modules/esm/loader:644:26)\n at async asyncRunEntryPointWithESMLoader (node:internal/modules/run_main:98:5)"},"msg": "operation failed"}
You can also include additional context along with the error if you use the mergingObject argument as follows:
1234567logger.error({statusCode: 500,err,},"operation failed",);
Using Pino serializers to shape your logs
Serializers are one of Pino's most powerful features. They allow you to transform specific properties in your log objects before they’re written. While they may seem similar to formatters, serializers serve a distinct purpose in your logging strategy.
Whereas formatters modify the overall log structure, serializers operate on individual properties, and only when those properties are present in the log payload.
You’ve already seen a serializer in action, perhaps without realizing it. When logging an Error object, Pino uses a built-in error serializer to extract useful details and wrap them under the err key.
12345const logger = pino({serializers: {err: pino.stdSerializers.err, // This is the default configuration},});
This ensures that logging an error instance produces a standardized object with the following fields:
12345{type: String, // Constructor name of the errormessage: String, // Error messagestack: String, // Stack trace}
Built-in serializers
Pino provides three standard serializers:
err– Handles JavaScript Error objects (enabled by default).req– Serializes HTTP request objects.res– Serializes HTTP response objects.
To use the req and res serializers, you need to explicitly enable them:
123456const logger = pino({serializers: {req: pino.stdSerializers.req,res: pino.stdSerializers.res,},});
When you log a req object as follows:
1234app.use((req, res, next) => {req.log.info({ req }, "incoming HTTP request");next();});
You’ll see a req object with the following structure in your log output:
12345678910{id: String,method: String,url: String,query: Object,params: Object,headers: Object,remoteAddress: String,remotePort: Number,}
Similarly, res objects will produce the following structure in the logs:
1234{statusCode: Number,headers: Object,}
Creating custom serializers
Beyond the built-in options, you can define custom serializers to control how values appear in logs. This is particularly useful for removing sensitive data, trimming verbose objects, or changing the presentation of some fields.
Serializers are triggered when a property in the logged object matches a key defined in the serializers configuration.
For example, you can create a user serializer that logs only the user ID:
123456789const logger = pino({serializers: {user: (user) => {return {id: user.id,};},},});
Then, log the user object like this:
1234567const user = {name: "John Doe",age: 30,email: "john.doe@gmail.com",id: "USR-123",};logger.info({ user }, "logging a user object");
The resulting log will include only the serialized user ID:
12345678{"level": 30,"time": 1746771337842,"pid": 16835,"hostname": "Falcon","user": { "id": "USR-123" },"msg": "logging a user object"}
Note that serializers are applied only when the property key matches exactly. If you log the object under a different key (e.g. usr instead of user), the serializer will not be invoked, and the full object will be logged.
Redacting or removing sensitive data
In addition to using custom serializers to filter out verbose or sensitive content, Pino offers a built-in redaction feature that automatically censors or removes specific fields from your logs.
This is especially useful when handling sensitive user data such as passwords, tokens, or personally identifiable information (PII).
To enable redaction, configure the redact option with a list of field paths you want to censor:
12345678910111213141516const logger = pino({redact: {paths: ["password", "user.creditCard", "*.sensitive"],censor: "[REDACTED]",},});logger.info({user: {id: "user123",password: "supersecret",creditCard: "1234-5678-1234-5678",},sensitive: "This will be redacted",normal: "This will remain",});
This will produce the following output:
1234567891011121314{"level": 30,"time": 1631234567890,"pid": 12345,"hostname": "Falcon","user": {"id": "user123","password": "[REDACTED]","creditCard": "[REDACTED]"},"sensitive": "[REDACTED]","normal": "This will remain","msg": ""}
By default, redacted fields are replaced with [Redacted], but you can customize this using the censor property:
123456const logger = pino({redact: {paths: ["password", "user.creditCard", "*.sensitive"],censor: "[REDACTED]",},});
If you prefer to omit redacted fields instead of replacing them with a placeholder, set remove: true:
123456const logger = pino({redact: {paths: ["password", "user.creditCard", "*.sensitive"],remove: true,},});
In this case, any matched fields will be stripped entirely from the log output.
For a more powerful redaction mechanism, see our article on redacting sensitive data with the OpenTelemetry Collector.
Using Pino transports to route logs
While Pino outputs logs to standard output by default, you can configure it to send logs to other destinations using its transports feature.
To write logs to a file, configure the transport option like this:
12345678const l = pino({transport: {target: "pino/file",options: { destination: "logs/app.log", mkdir: true }, // log to a file// options: { destination: 1 }, // log to stdout// options: { destination: 2 }, // log to stderr},});
Although pino/file logs to standard output by default, specifying a destination path sends logs to a file instead. The mkdir option ensures that the destination directory exists before writing.
Note that the pino/file transport does not support log rotation. For that, consider using pino-roll or a system utility like logrotate.
Logging to multiple destinations
You can simultaneously log to multiple outputs, such as the console, a file, and an OTLP endpoint, using the targets array:
123456789101112131415161718const l = pino({transport: {targets: [{target: "pino-pretty",options: { colorize: true },},{target: "pino/file",options: { destination: "logs/app.log" },},{target: "pino-opentelemetry-transport",level: "error",},],},});
This setup allows you to:
- Display formatted logs in the console.
- Persist structured JSON logs to disk.
- Forward errors to an observability backend (e.g., via OTLP).
By default, each transport runs in a separate worker thread to avoid blocking the main event loop. If you need to log synchronously (e.g., during early startup or shutdown), you can enable this by setting sync: true in the transport’s options:
1234{target: "pino/file",options: { destination: "logs/app.log", sync: true },}
Pino supports a growing ecosystem of transports. You’ll find options for streaming logs to:
- External databases (PostgreSQL, MongoDB, etc).
- Log management platforms.
- Telemetry pipelines (e.g. OpenTelemetry Collector).
For a list of known transports, see the official Pino documentation.
Granular logging with per-transport level control
Pino allows you to achieve highly granular control over your log output by setting different log levels for each destination.
For instance, you might want debugging messages written to the console, while informational and error logs are placed in separate files.
Here’s an example:
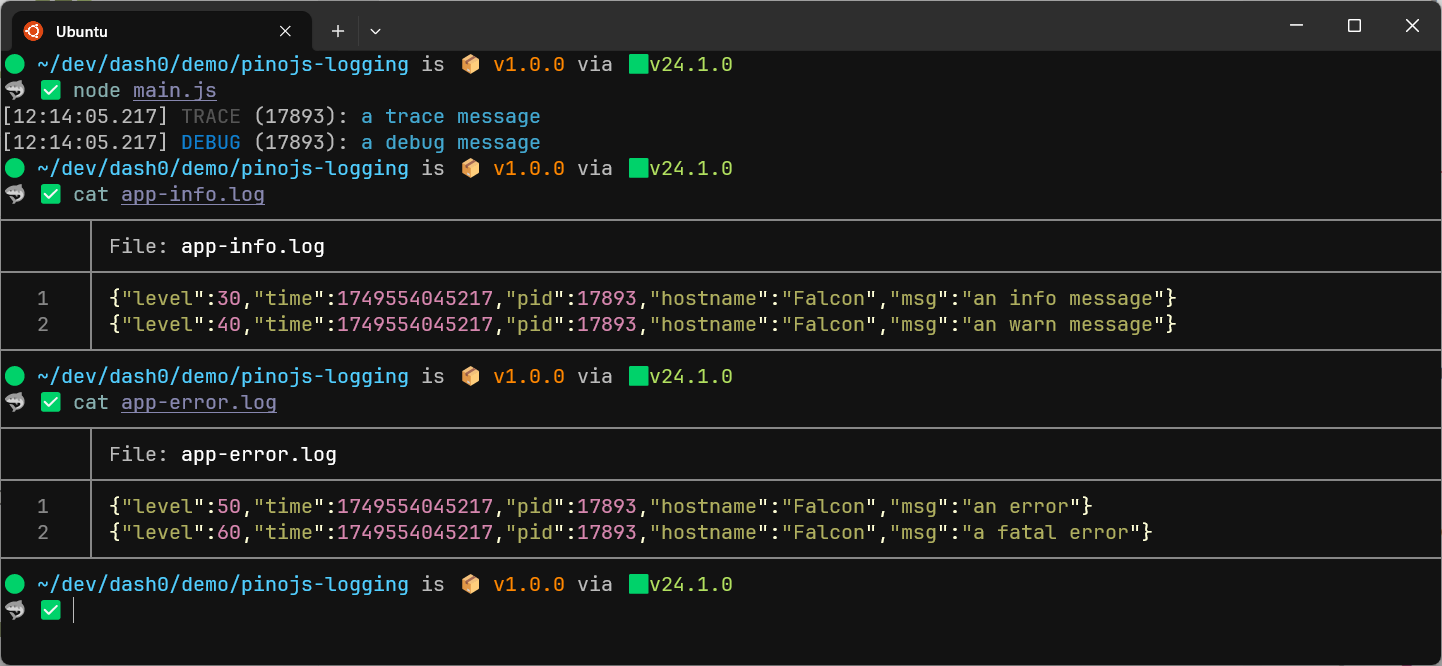
12345678910111213141516171819202122232425262728293031import pino from "pino";const logger = pino({level: "trace", // Allow all messages through for transport handlingtransport: {targets: [{target: "pino-pretty",options: { colorize: true },level: "trace",},{target: "pino/file",options: { destination: "app-info.log" },level: "info",},{target: "pino/file",options: { destination: "app-error.log" },level: "error",},],},});logger.trace("a trace message");logger.debug("a debug message");logger.info("an info message");logger.warn("an warn message");logger.error("an error");logger.fatal("a fatal error");
In this setup, a message must first pass the logger’s main level check (set to trace here to allow everything). Then, for each transport, it must also meet the configured level threshold to be written to that specific destination.
The result is that all logs will be written to the console in a prettified format, info logs and above will be in the app-info.log file, while error logs and above will be placed in the app-error.log file.

If you’d rather log only to the transport with the higher level, you can use the dedupe option:
1234567const logger = pino({level: "trace",transport: {targets: [...],dedupe: true,},});
You will observe that trace and debug logs are now sent alone to the console, the info and warn logs are placed in app-info.log, and the error and fatal log are placed in app-error.log.
With this approach, you can even send each log level to a different location without duplicating them.
Integrating Pino with Node.js frameworks
Pino integrates seamlessly with many Node.js web frameworks, allowing you to take advantage of its high-performance structured logging without extensive setup.
In this section, I'll show you how to integrate Pino’s logger in Express and Fastify applications.
Using Pino in Fastify apps
Pino is built into Fastify as its default logger, but you’ll need to explicitly enable it when creating your Fastify instance:
12345import Fastify from "fastify";const app = Fastify({logger: true,});
With logging enabled, Fastify will automatically emit structured logs for incoming requests and outgoing responses. You can also access the logger in your route handlers using request.log:
12345app.get("/", async (request, reply) => {request.log.info("Handling GET /");return { message: "Hello from Fastify with logging!" };});
You can also use the Fastify instance itself to log global messages:
1app.log.info("Something happened");
One of the key benefits of Fastify’s integration with Pino is automatic request context propagation. Each request is tagged with a unique reqId, and all logs related to that request include this ID, making it easy to trace the full lifecycle of a request:
123{"level":30,"time":1746701447906,"pid":97257,"hostname":"Falcon","reqId":"req-1","req":{"method":"GET","url":"/","host":"localhost:3000","remoteAddress":"127.0.0.1","remotePort":37230},"msg":"incoming request"}{"level":30,"time":1746701447907,"pid":97257,"hostname":"Falcon","reqId":"req-1","msg":"Handling GET /"}{"level":30,"time":1746701447910,"pid":97257,"hostname":"Falcon","reqId":"req-1","res":{"statusCode":200},"responseTime":3.6392619907855988,"msg":"request completed"}
You can customize how the request ID is generated or logged using the following Fastify options:
If you prefer to log requests manually or use a different logging strategy, you can disable automatic request logging:
123const app = Fastify({disableRequestLogging: true,});
Fastify also allows you to supply your own Pino logger instance, which is useful if you want to customize things like formatting, metadata, redaction, or transports.
1234567const logger = pino({// configure Pino here});const app = Fastify({loggerInstance: logger,});
This setup gives you full control over how logs are formatted, where they’re sent, and what they contain.
Using Pino in Express apps
To integrate Pino into an Express server, you'll need the pino-http middleware, which captures and logs HTTP request and response data automatically.
Start by installing and configuring it like so:
1npm install pino-http
12345678import express from "express";import logger from "pino-http";const app = express();app.use(logger());// [...]
With this in place, Pino will log every incoming request and corresponding response. A typical log entry looks like this:
12345678910111213141516171819202122232425262728293031{"level": 30,"time": 1746702830859,"pid": 99260,"hostname": "Falcon","req": {"id": 1,"method": "GET","url": "/","query": {},"params": {},"headers": {"host": "localhost:3000","user-agent": "curl/8.5.0","accept": "*/*"},"remoteAddress": "::1","remotePort": 58304},"res": {"statusCode": 200,"headers": {"x-powered-by": "Express","content-type": "text/html; charset=utf-8","content-length": "29","etag": "W/\"1d-Qhqp0Uq+s7leZTpOIh6rTJi0kCY\""}},"responseTime": 4,"msg": "request completed"}
These detailed req and res objects are the result of the built-in request and response serializers provided by Pino, as discussed earlier.
The Pino logger is also automatically available in route handlers via req.log:
1234app.get("/", (req, res) => {req.log.info("Hello from route handler!");res.send("Hello from Express!");});
Which produces:
1{"level":30,"time":1746703305872,"pid":99903,"hostname":"Falcon","req":{"id":1,"method":"GET","url":"/","query":{},"params":{},"headers":{"host":"localhost:3000","user-agent":"curl/8.5.0","accept":"*/*"},"remoteAddress":"::1","remotePort":44538},"msg":"Hello from route handler!"}
By default, req.log also include the full request object in every log, which can be verbose. You can reduce this by enabling the quietReqLogger option, which replaces the full req object with a simple reqId:
12345app.use(logger({quietReqLogger: true,}),);
12345678{"level": 30,"time": 1746703868536,"pid": 100301,"hostname": "Falcon","reqId": 1,"msg": "Hello from route handler!"}
To capture and log uncaught errors, configure an Express error-handling middleware that uses req.log.error():
1234app.use((err, req, res, next) => {req.log.error(err, err.message);res.status(500).json({ error: "Internal server error " });});
This ensures that exceptions occurring in route handlers are recorded in your logs, complete with stack traces and context.
For more configuration options, consult the official pino-http documentation. You can provide a custom Pino instance, customize request ID generation, and more to suit your application’s needs.
Integrating Pino with OpenTelemetry
Pino supports integration with OpenTelemetry via the pino-opentelemetry-transport package. This transport transforms Pino logs to match the OpenTelemetry Log Data Model and sends them to an OTLP endpoint (usually the OpenTelemetry Collector).
You can install the transport with:
1npm i pino-opentelemetry-transport
Once installed, you can configure the transport in your logger setup:
123456789101112const logger = pino({transport: {targets: [{target: "pino-opentelemetry-transport",options: {loggerName: "myLogger",},},],},});
This will automatically convert your logs into the OpenTelemetry format and forward them to the configured OTLP endpoint.
By default, the logs are sent using the http/protobuf protocol to the default OTLP HTTP endpint, but you can control this and other behaviors using environment variables:
12OTEL_EXPORTER_OTLP_LOGS_PROTOCOL=http/protobufOTEL_EXPORTER_OTLP_ENDPOINT=http://localhost:4318
For debugging or inspecting the transformed log entries, you can use the console protocol, which prints OpenTelemetry-formatted logs to standard output:
1OTEL_EXPORTER_OTLP_LOGS_PROTOCOL='console' node index.js
This will produce a verbose representation of each log entry. For example, a basic Express request log might look like this:
1234567891011121314151617181920212223242526272829303132333435363738394041424344454647{resource: {attributes: {'process.pid': 29535,'process.executable.name': '/home/ayo/.local/share/mise/installs/node/24.0.0/bin/node','host.name': 'Falcon','host.arch': 'amd64','host.id': 'b8c8a123fc8c4017a34ac35736984212'// ... additional system metadata ...}},instrumentationScope: { name: 'myLogger', version: undefined, schemaUrl: undefined },timestamp: 1746780983073000,traceId: undefined,spanId: undefined,traceFlags: undefined,severityText: 'info',severityNumber: 9,body: 'request completed',attributes: {reqId: 1,req: {id: 1,method: 'GET',url: '/',query: {},params: {},headers: {host: 'localhost:3000','user-agent': 'curl/8.5.0',accept: '*/*'},remoteAddress: '::1',remotePort: 43352},res: {statusCode: 200,headers: {'x-powered-by': 'Express','content-type': 'text/html; charset=utf-8','content-length': '19',etag: 'W/"13-tsbq4e7agwVV6r9iE+Lb/lLwlzw"'}},responseTime: 3}}
Compared to standard Pino output, OpenTelemetry-formatted logs include several key structural changes:
resource: Captures system, OS, process, and runtime metadata automatically.instrumentationScope: Identifies the library or logger responsible for the log.severityTextandseverityNumber: Replaces the numeric level field with OpenTelemetry-compliant fields.body: Contains the original log message (msg).attributes: Houses all contextual log data, such as request and response metadata.traceId,spanId, andtraceFlags: Enables correlation with distributed tracing spans when a span context is active.
Converting logs to the OpenTelemetry format allows you to correlate them with other telemetry signals to provide a more complete view of system behavior.
However, there’s still a few issues with this log as the attributes do not follow the OpenTelemetry Semantic Conventions for HTTP properties. To fix this, you can define custom serializers for req and res objects:
1234567891011121314151617181920212223242526272829303132333435363738394041const customReqSerializer = (req) => {const url = new URL(`${req.protocol}://${req.get("host")}${req.originalUrl}`);return {"http.request.method": req.method,"url.full": url,"url.scheme": req.protocol,"user_agent.original": req.headers["user-agent"],};};const customResSerializer = (res) => {return {"http.response.status_code": res.statusCode,};};const l = pino({serializers: {req: customReqSerializer,res: customResSerializer,},transport: {targets: [{target: "pino-opentelemetry-transport",options: {loggerName: "myLogger",},},],},});app.use(logger({logger: l,quietReqLogger: true,wrapSerializers: false, // add this for the custom serializers to work}),);
This now produces attributes that look like this:
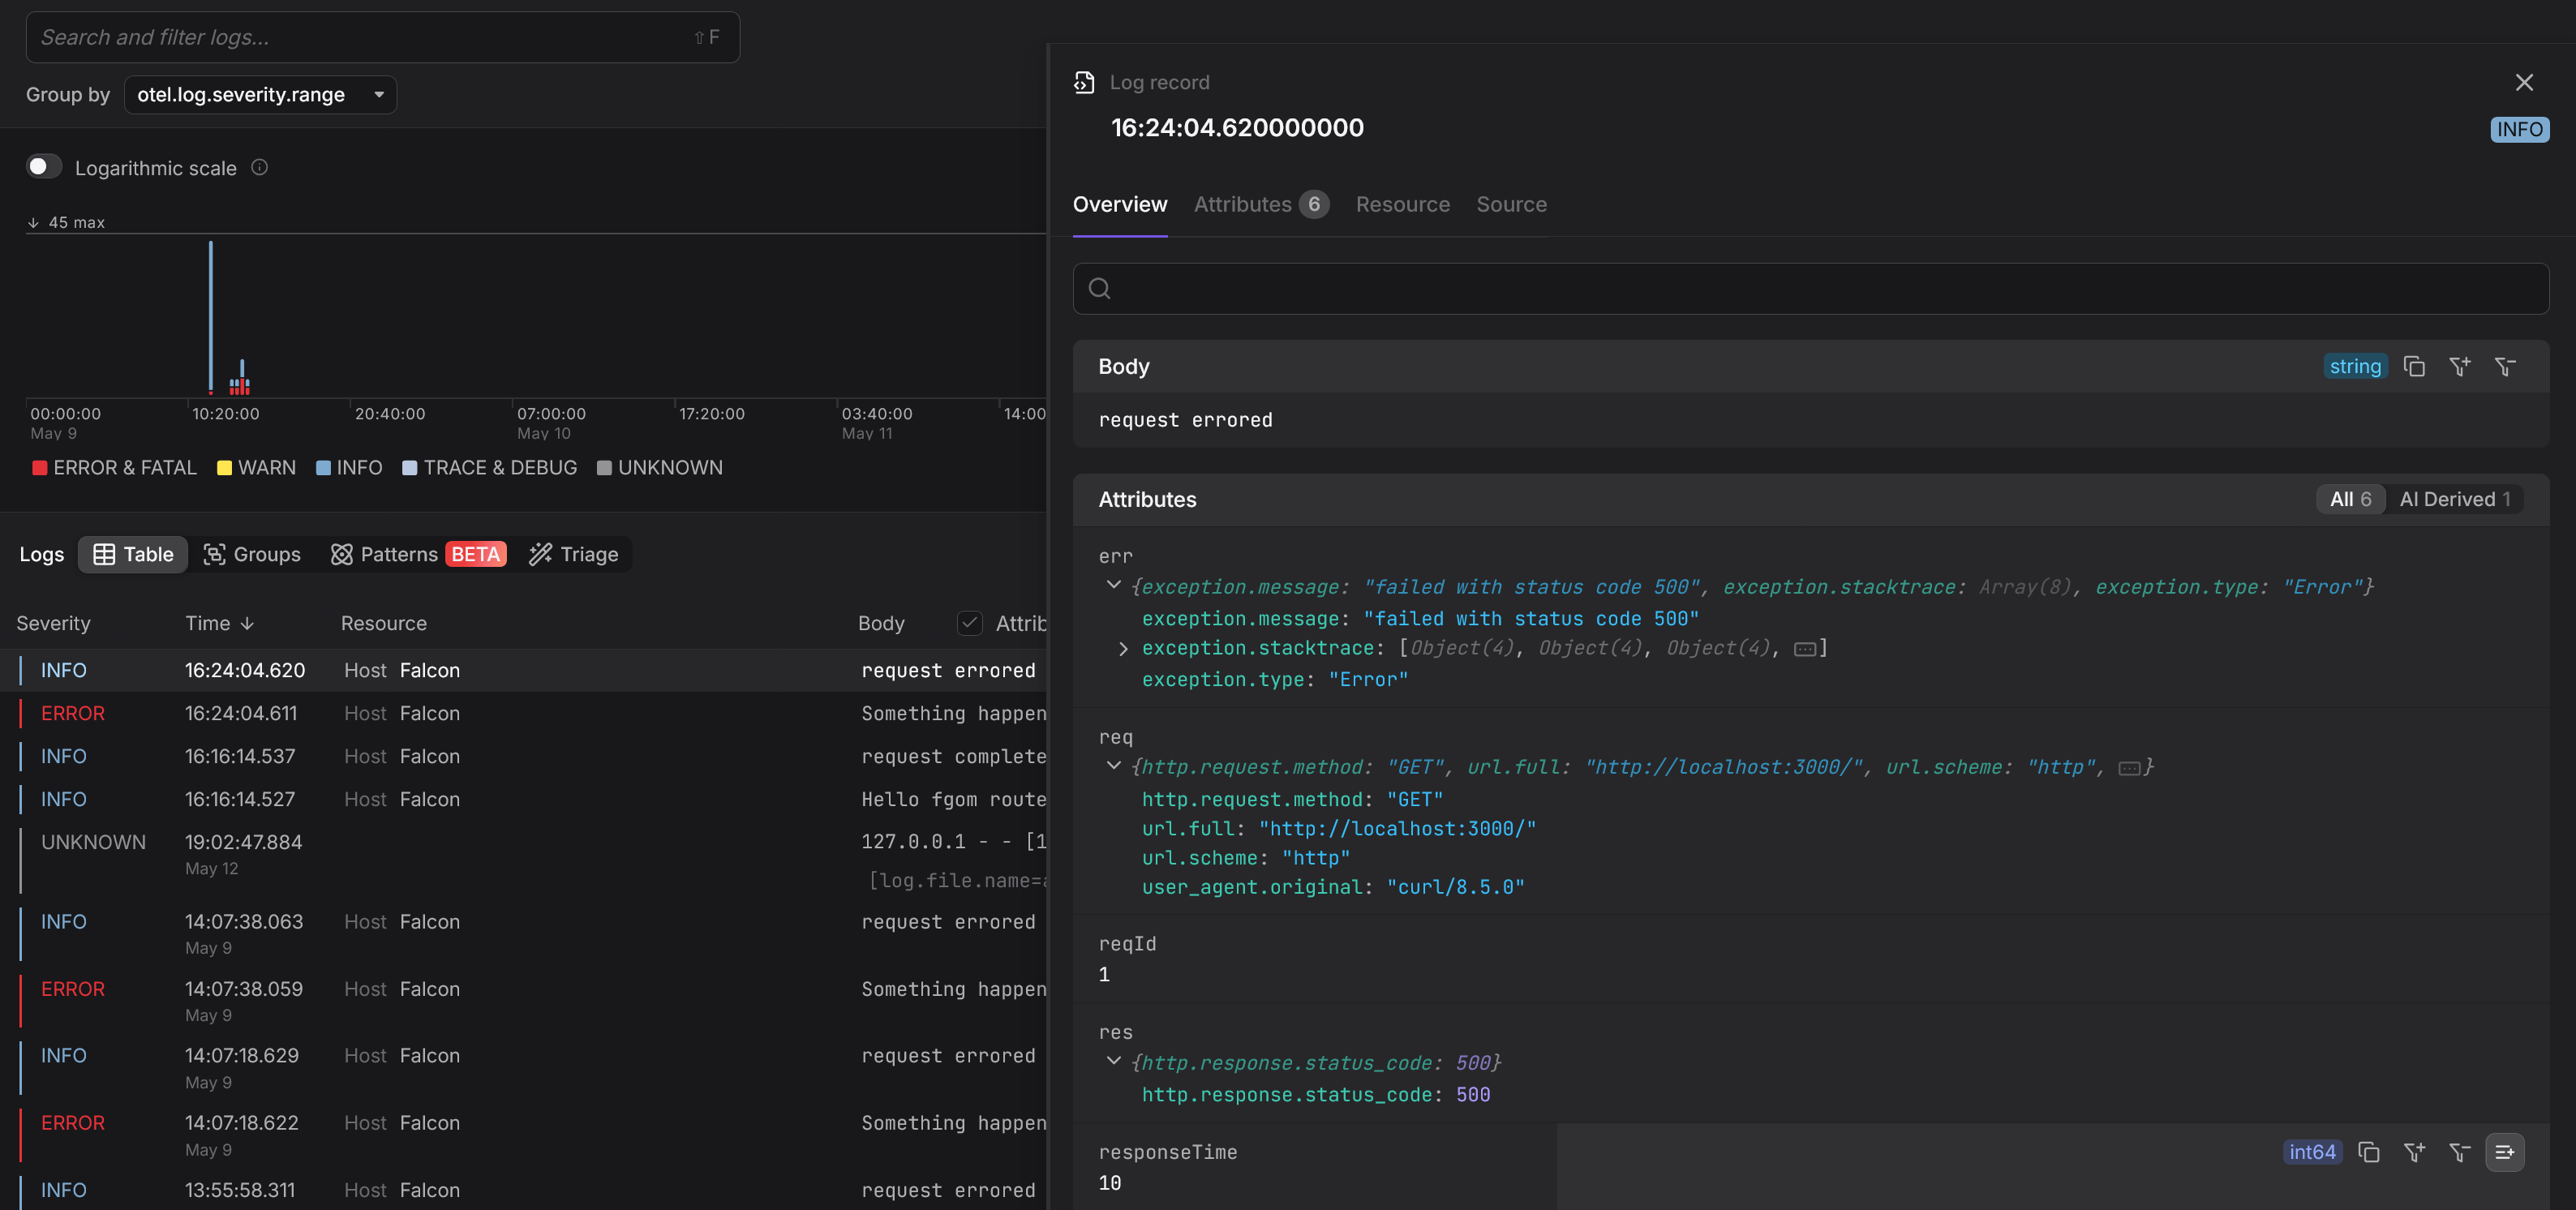
1234567891011attributes: {reqId: 1,req: {'http.request.method': 'GET','url.full': 'http://localhost:3000/','url.scheme': 'http','user_agent.original': 'curl/8.5.0'},res: { 'http.response.status_code': 200 },responseTime: 10}
The keys are now OpenTelemetry-compliant, but they remain nested in req and res objects which is not ideal. To fix this, you’ll need to create your own middleware that flattens the serialized fields instead of using pino-http.
Centralizing Node.js logs in Dash0
Once your Pino logger is configured and producing structured output, the next step is to send those logs to an observability platform where they can be aggregated, searched, filtered, and correlated with other signals such as traces and metrics.
Dash0 is one such solution that offers seamless integration with Pino through the pino-opentelemetry-transport package. You only need to configure the following environmental variables when starting your service:
123OTEL_SERVICE_NAME="<your_application_name>"OTEL_EXPORTER_OTLP_ENDPOINT="<your_dash0_otlp_endpoint>"OTEL_EXPORTER_OTLP_HEADERS="Authorization=Bearer <your_dash0_secret_token>, Dash0-Dataset=<your_dash0_dataset>"
Within moments, your logs will begin appearing in the Dash0 interface, where you can inspect, filter, and correlate them as needed:
Final thoughts
In 2025, Pino remains the undisputed champion for high-performance logging in Node.js applications. Its exceptional speed and minimal overhead make it ideal for production environments where performance is critical.
By enhancing Pino with OpenTelemetry integration, you can maintain this performance advantage while gaining the benefits of unified observability.
This combination delivers the best of both worlds: blazing-fast logging that seamlessly integrates into a comprehensive monitoring solution.
Thanks for reading!
