Last updated: July 1, 2025
What is Jaeger Tracing?
Monitoring and troubleshooting can be challenging in microservices applications due to the complexity of interactions between various components. The Jaeger project, which started at Uber Technologies and is now a Graduated CNCF project, is a powerful distributed tracing platform to instrument.
This article delves into Jaeger, how it does distributed tracing, what troubleshooting capabilities it provides, and why it is invaluable for developers working with distributed systems. It also discusses the limitations of Jaeger’s distributed tracing and compares it to complete observabilty platforms.
Jaeger is an open-source, end-to-end distributed tracing system that helps developers monitor and troubleshoot transactions in complex, distributed systems. Its primary goal is to enable efficient root-cause analysis of performance issues and service dependencies in a microservices architecture.
It provides observability through the visualization of traces spanning multiple services, helping to identify latency issues and optimize service performance.
Key Features of Jaeger Tracing
- Distributed Context Propagation: Jaeger facilitates tracing requests as they traverse through various services in a distributed system. It tracks the entire journey of requests, capturing crucial data at each step. The original concept was inspired by OpenTracing, which resulted in a set of tracers and instrumentations for various programming languages, the Jaeger client libraries. However, the Jaeger-specific tracers have been discontinued in favor of OpenTelemetry.
- Performance and Latency Optimization: By providing insights into the time services take to process requests and communicate with other services, Jaeger helps identify bottlenecks and improve overall performance.
- Root Cause Analysis: Jaeger's detailed visualizations of request flows and performance metrics allow teams to pinpoint the root causes of issues more quickly than traditional logging systems.
- Service Dependency Analysis: Jaeger automatically generates graphs showing how different services interact, which is vital for understanding and optimizing service dependencies and resource allocation.
- Real-time Monitoring and Alerts: Jaeger supports real-time monitoring of services and can be configured to send alerts based on specific triggers, such as performance anomalies.
How Jaeger Tracing Works
Jaeger's operation is based on the concept of spans A span represents a unit of work or operation. Spans are the building blocks of Traces. In OpenTelemetry, they include important information such as Name, Start and End as well as references to other Spans, especially the Parent Span, to build a visual, usually tree like, representation of cause and effect.
- Trace: A trace represents a single-user transaction or workflow as it ramifies through a distributed system. A trace is a collection of spans, forming a tree-like structure.
- Span: A span represents a logical unit of work done by a service, containing key information such as operation name, duration, and additional metadata.
Read the What is Distributed Tracing article to learn more about distributed tracing.
Jaeger used to have its client-side libraries for instrumentation, but those have been deprecated as Jaeger moved to support OpenTelemery and the otlp format. You can send to Jaeger OpenTelemetry tracing data generated via OpenTelemetry’s auto-instrumentation agents or manual instrumentation using OpenTelemetry SDK/libraries.
Jaeger ingestion pipeline, called Jaeger collector (not to be confused with the OpenTelemetry collector!) to store the spans it receives, but also supports adaptive sampling out of the box.
It is possible to use the OpenTelemetry collector together with the Jaeger collector—in this case, the OTel collector sits in front of the Jager Collector. To understand more about the OTel collector and how you can use OTelBin to configure it visually, see our blog post OTelBin—Visualizing and improving OpenTelemetry Collector Configurations.
Integrations and Usage
Thanks to its compatibility with OpenTelemetry, you can use Jaeger to visualize traces collected by applications written in any programming language with an OpenTelemetry SDK, such as Java, .NET, Go, Python, Node.js, Rust, and C++.
Jaeger supports various backends for data storage, including Elasticsearch, Apache Kafka, and Cassandra. The community also supports Clickhouse as an external storage.Jaeger needs to be installed and deployed on your machines on-premises or in the cloud, and scaling is done by scaling out the individual components of Jaeger that, like all operation tasks about Jaeger, are usually the responsibility of the organization adopting Jaeger in the first place.
Jaeger UI: Working with Distributed Traces
This part will explain how to use the Jaeger UI or Jaeger Console to investigate your distributed tracing data.
Jaeger Traces List

In the above screenshot we can see a list of all Traces that have used the adservice service of the OpenTelemetry demo application.
The graph shows the distribution of the traces by duration and also indicates whether there were errors in the trace.
The list can be filtered by operations, tags, or duration—this helps you search for traces that interest you and that you can investigate in more detail.
Jaeger Trace View
Each trace can be visualized in isolation in the Trace View.
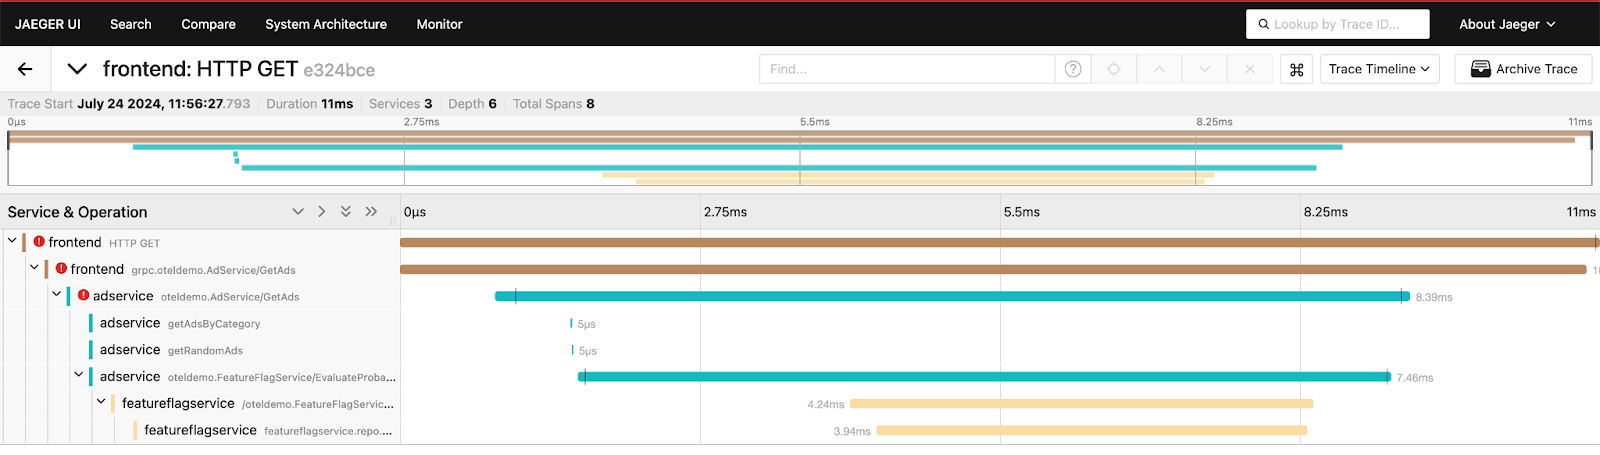
The trace view gives an overview of the span duration and a breakdown of the trace by span. The spans are colored by service, and in the tree, they are split up by operation. This breakdown simplifies understanding where bottlenecks and errors originate in the distributed system.
Opening the details of a span will show the span attributes, the process attributes (effectively, OpenTelemetry’s resource attributes, see article about OpenTelemetry Resources) and the logs/events of the span:

The attributes can be seen as a list of key-value pairs; the values are formatted based on their type. (OpenTelemetry supports various types of attribute values: strings are by far the most common in practice, and numbers are often used for metadata describing networking aspects, like port; others, like booleans, bytes, arrays, and nested maps, are far less common.)

Using standardized attributes greatly improves the experience of using Jaeger in larger organizations: for example, it is easier to interpret data from parts of the system that are responsibilities of different teams. You should consider adhering to the OpenTelemetry semantic conventions whenever possible to model your attributes. The “OpenTelemetry Resources: What They Are, why you need them, and Why They Are Awesome” talk is a good starting point for getting acquainted with OpenTelemetry semantic conventions and the value they bring.
Jaeger System Architecture
Jaeger also provides a basic visualization of the system architecture using a directed graph map of all microservices involved in the traces collected.

This view is essential for understanding the architecture, identifying possible bottlenecks in the system, and determining the number of calls to each individual node.
Jaeger Service Monitoring
Last but not least, Jaeger also has a Service Monitoring view that shows the Requests, Errors, and Duration (RED) metrics of a service and the associated operations. RED metrics are a staple of operating distributed systems, and they are a good starting point for assessing a system's performance as perceived by its end users.

Jaeger 2.0
On November 12th Yuri Shkuro and the Jaeger contributors announced the release of version 2.0 of Jaeger.
Jaeger v2 represents a significant milestone in distributed tracing, with OpenTelemetry now integrated into its core architecture. This major release marks a shift from Jaeger's original data model to fully embracing OpenTelemetry's trace data model, making it more aligned with modern observability standards and eliminating the need for protocol translation between OpenTelemetry and Jaeger's native format.
The new version also brings substantial improvements including enhanced query capabilities, better scalability through a new storage engine, and improved visualization features in the UI. Additionally it simplifies the deployment architecture by removing the need for collectors to convert between different data formats, making it more efficient and easier to maintain while providing better compatibility with the broader OpenTelemetry ecosystem.
Conclusion
Distributed tracing is an essential tool for developers and companies working with distributed systems. It provides crucial insights into system behavior and performance. Jaeger is a really good tool to get started with OpenTelemetry and distributed tracing. It is Open-Source, free, and can be installed on any server on-premises or in the cloud.
Jaeger’s ability to trace individual requests across multiple services and visualize complex interactions in real-time makes it invaluable for improving system reliability and efficiency.
Whether you're troubleshooting an issue or simply monitoring your systems, Jaeger offers a robust solution to modern distributed system challenges that can be scaled based on the used components.
Jaeger’s main limitation is that it is limited to processing and querying spans and traces. Metrics, logs, dashboards, and alerting based on them are also fundamental for troubleshooting problems in production, especially having the full context of issues.
Moreover, since you install OSS software on your machines, you also usually must operate and scale Jaeger. Since monitoring systems are the most needed when problems are ongoing, you need to manage your monitoring software as well as your applications (if not better!), including non-trivial aspects like scaling. In this respect, some observability vendors provide better user experience and integrated support to find issues with extended analytics and machine learning.
For people starting their distributed-tracing journey to improve the observability of their systems, Jaeger is a great tool for starting out and for understanding the underlying concepts.
If you use Jaeger and want to try out Dash0 for a full observability platform that is OpenTelemetry-native, it should only take a few minutes to get started.