Introduction to Zap: The Lightning-Fast Logger for Go Applications
In the Go ecosystem, performance and efficiency are paramount values. Zap, developed by Uber, has emerged as the premier logging solution for Go applications, delivering exceptional speed and minimal overhead while providing rich, structured logging capabilities that modern applications demand.
Why Zap Dominates the Go Logging Landscape
Zap has earned its reputation as the go-to logging framework for performance-conscious Go developers through several key advantages:
- Blazing Speed: Benchmark-proven to be significantly faster than alternatives
- Allocation-Free Logging: Minimizes garbage collection overhead
- Structured Logging: Native JSON output for better searchability and analysis
- Flexible Configuration: Options for both development and production environments
- Level Management: Dynamic log level control for fine-grained output
- Field System: Type-safe fields for structured context addition
- Sampling Capabilities: Intelligent reduction of repetitive log volume
- Pluggable Architecture: Extensible encoders and output destinations
Getting Started with Zap
Adding Zap to your Go project is straightforward:
1go get -u go.uber.org/zap
Basic usage in a Go application:
1345789101213141516171819202122232425262728package mainimport ("go.uber.org/zap")func main() {// Quick start with production defaultslogger, _ := zap.NewProduction()defer logger.Sync() // Flush buffer before application exits// Structured context as strongly typed fieldslogger.Info("Server started",zap.String("protocol", "https"),zap.Int("port", 443),zap.String("environment", "production"),)// Log different levels with contextlogger.Debug("Debug information")logger.Warn("Resource utilization high", zap.Float64("cpu", 0.95))// Error logging with stack traceslogger.Error("Failed to connect to database",zap.String("database", "customers"),zap.Error(errors.New("connection refused")),)}
For development-friendly logging:
1logger, _ := zap.NewDevelopment()
Enhancing Zap with OpenTelemetry for Complete Go Observability
While Zap excels at structured logging, modern microservice architectures demand a more integrated approach to observability. By combining Zap with an OpenTelemetry-native observability platform, you can transform isolated logs into components of a unified monitoring strategy.
This powerful integration enables:
- Trace Context Enrichment: Automatically add trace and span IDs to your log entries
- Log-Trace Correlation: Connect logs directly to distributed traces for context-rich debugging
- Cross-Service Visibility: Track requests across service boundaries with correlated logs
- Unified Monitoring: Manage logs, metrics, and traces through a single platform
- Performance Correlation: Link performance metrics directly to log events
Implementing Zap with OpenTelemetry
Setting up the integration is straightforward:
13456789101213141516171920212324252627293031323334353637383940414243444547484950515253545556575859606162636465666768697071package mainimport ("context""go.uber.org/zap""go.uber.org/zap/zapcore""go.opentelemetry.io/otel""go.opentelemetry.io/otel/trace"sdktrace "go.opentelemetry.io/otel/sdk/trace")// Create a custom core that adds trace contextfunc traceContextCore(core zapcore.Core) zapcore.Core {return &traceContextCore{Core: core,}}type traceContextCore struct {zapcore.Core}func (c *traceContextCore) With(fields []zapcore.Field) zapcore.Core {return &traceContextCore{Core: c.Core.With(fields),}}func (c *traceContextCore) Check(ent zapcore.Entry, ce *zapcore.CheckedEntry) *zapcore.CheckedEntry {if ce != nil {span := trace.SpanFromContext(context.Background())if span.SpanContext().IsValid() {traceID := span.SpanContext().TraceID().String()spanID := span.SpanContext().SpanID().String()fields := []zapcore.Field{zap.String("trace_id", traceID),zap.String("span_id", spanID),}ce = ce.With(fields...)}}return ce}func main() {// Initialize OpenTelemetrytp := sdktrace.NewTracerProvider()otel.SetTracerProvider(tp)tracer := tp.Tracer("example.com/zap")// Create base loggerconfig := zap.NewProductionConfig()config.EncoderConfig.TimeKey = "timestamp"config.EncoderConfig.EncodeTime = zapcore.ISO8601TimeEncoderbaseLogger, _ := config.Build()// Wrap with trace contextcore := baseLogger.Core()tracedCore := traceContextCore(core)logger := zap.New(tracedCore)// Create a spanctx, span := tracer.Start(context.Background(), "operation")defer span.End()// Log with trace context automatically includedlogger.Info("This log will contain trace context")}
Analyzing OpenTelemetry Logs in Dash0
Logs can be directly routed into Dash0. Dash0 with OpenTelemetry provides the ability to filter, search, group, and triage within a simple user interface, with full keyboard support. Dash0 also gives full log context by showing trace context, the call and resource that created the log - including details like the Kubernetes Pod, server, and cloud environment.
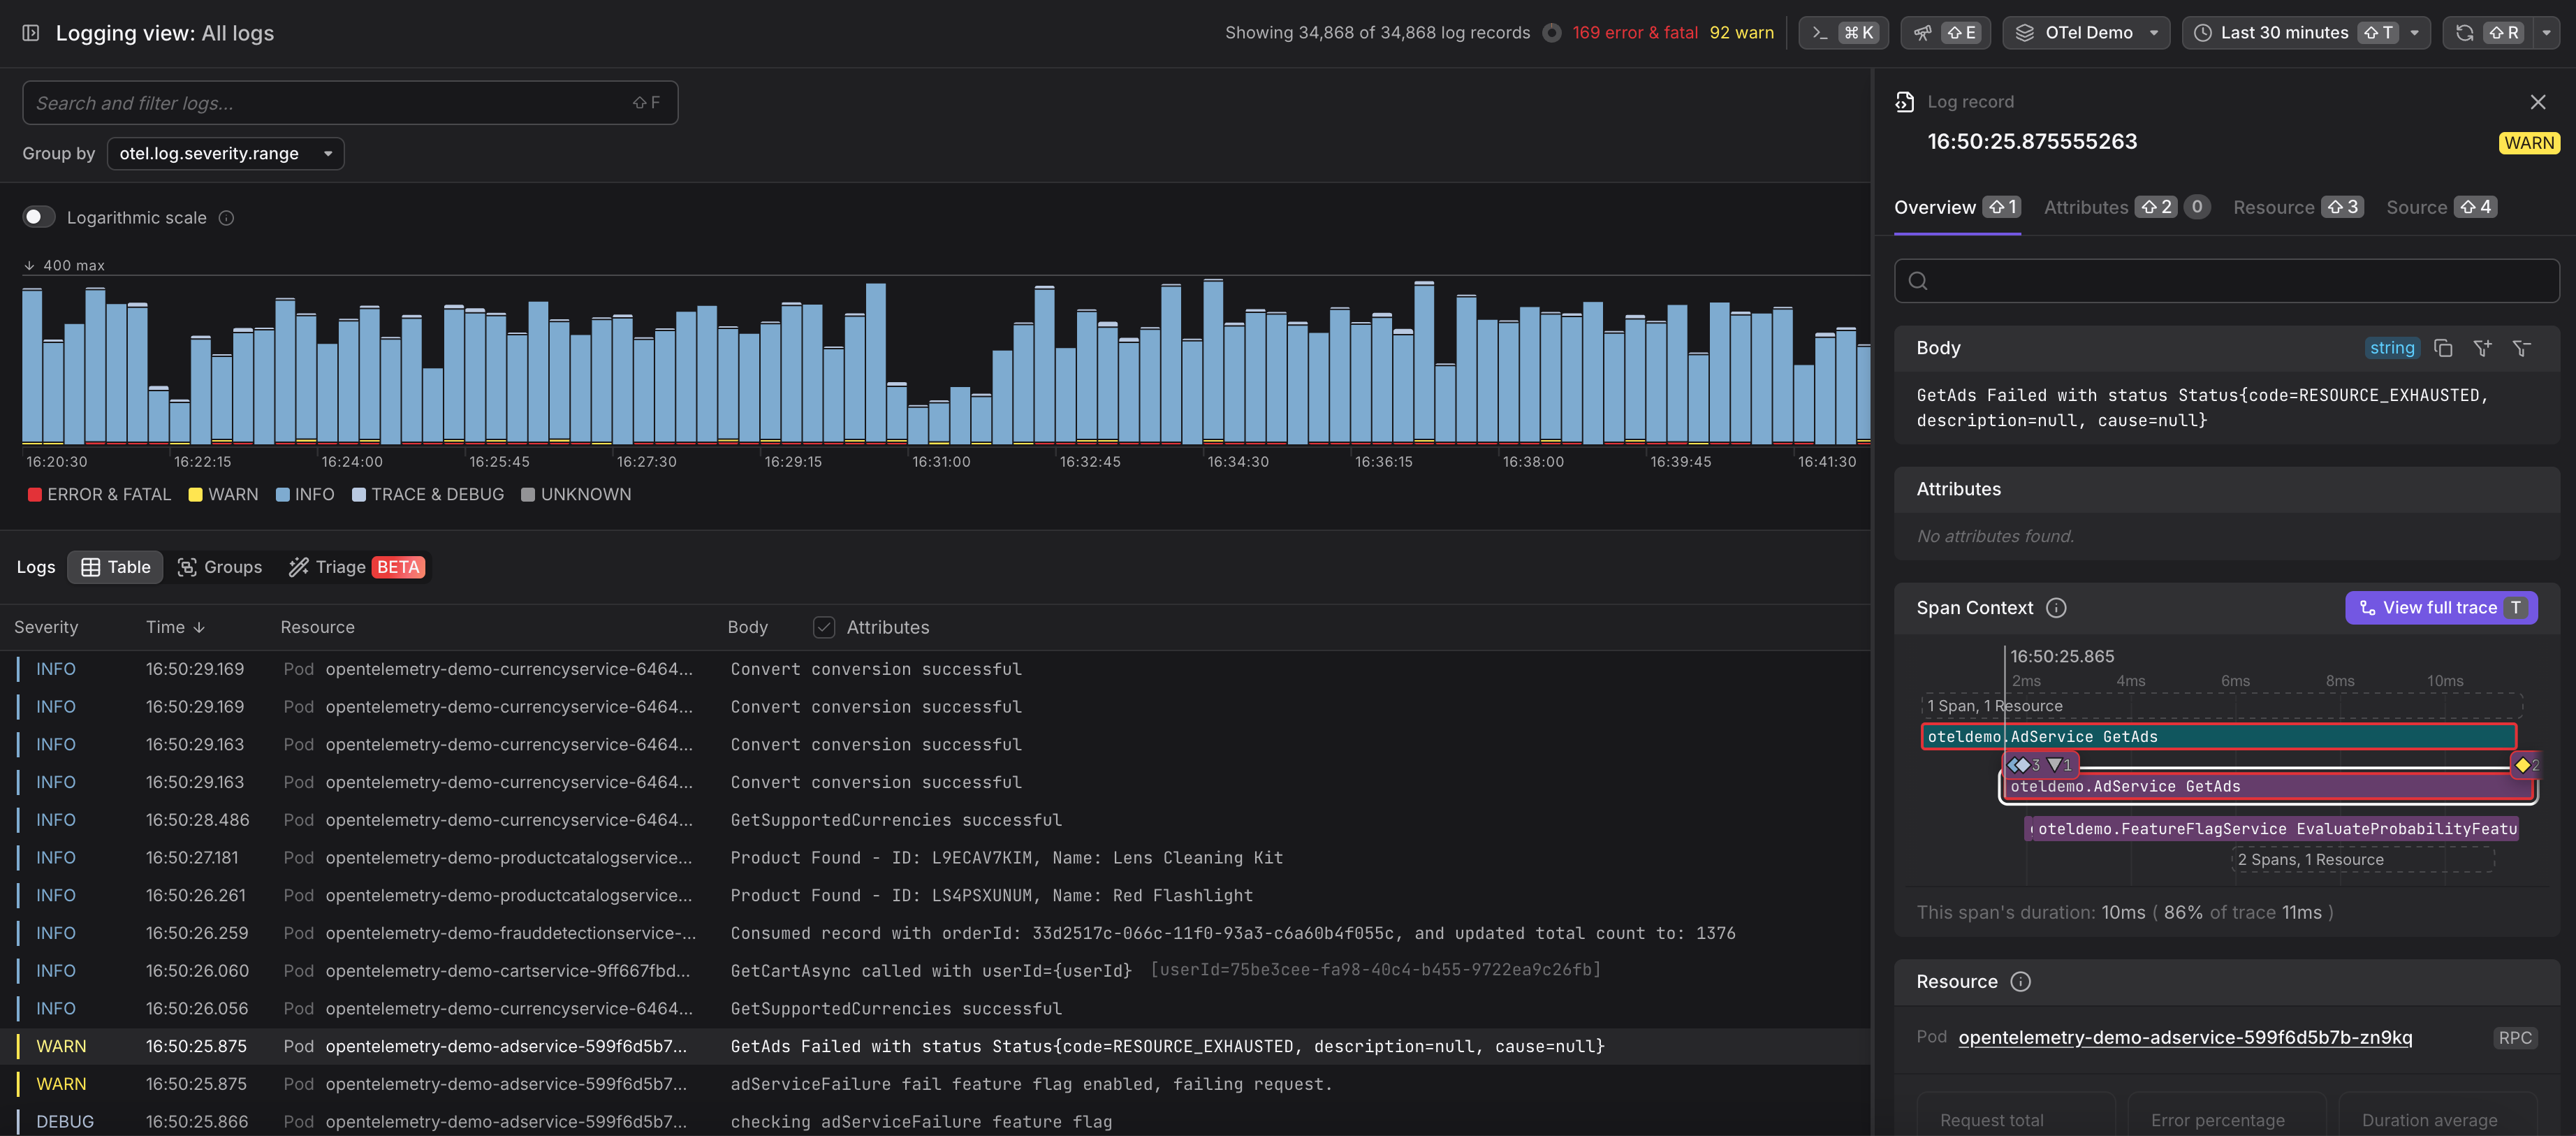
Log AI also enhanced the logs with more semantical metadata and structure without any manual pattern declaration.
Conclusion
In 2025, Zap remains the gold standard for logging in Go applications, offering unmatched performance and structured logging capabilities. Its combination of blazing speed, minimal memory allocation, and rich features makes it ideal for everything from high-throughput microservices to resource-constrained environments.
By enhancing Zap with OpenTelemetry integration, developers can maintain this performance advantage while gaining the benefits of unified observability. This combination delivers powerful insights by connecting logs with traces and metrics, enabling faster problem resolution and better application understanding.
For Go applications that demand both high-performance logging and comprehensive observability, Zap with OpenTelemetry integration provides an ideal solution that aligns perfectly with Go's performance-first philosophy while supporting the complex monitoring needs of modern distributed systems.