Dash0 Raises $110M Series B at $1B Valuation
Dash0 integrates AWS CloudWatch Metrics via Amazon Firehose, providing real-time visibility into your AWS environments.
AWS CloudWatch Metrics provide real-time insights into the performance and health of AWS resources and applications such as EC2, Lambda, API Gateway, and more. For better usability and control, you can send these metrics to Dash0 via Firehose stream.
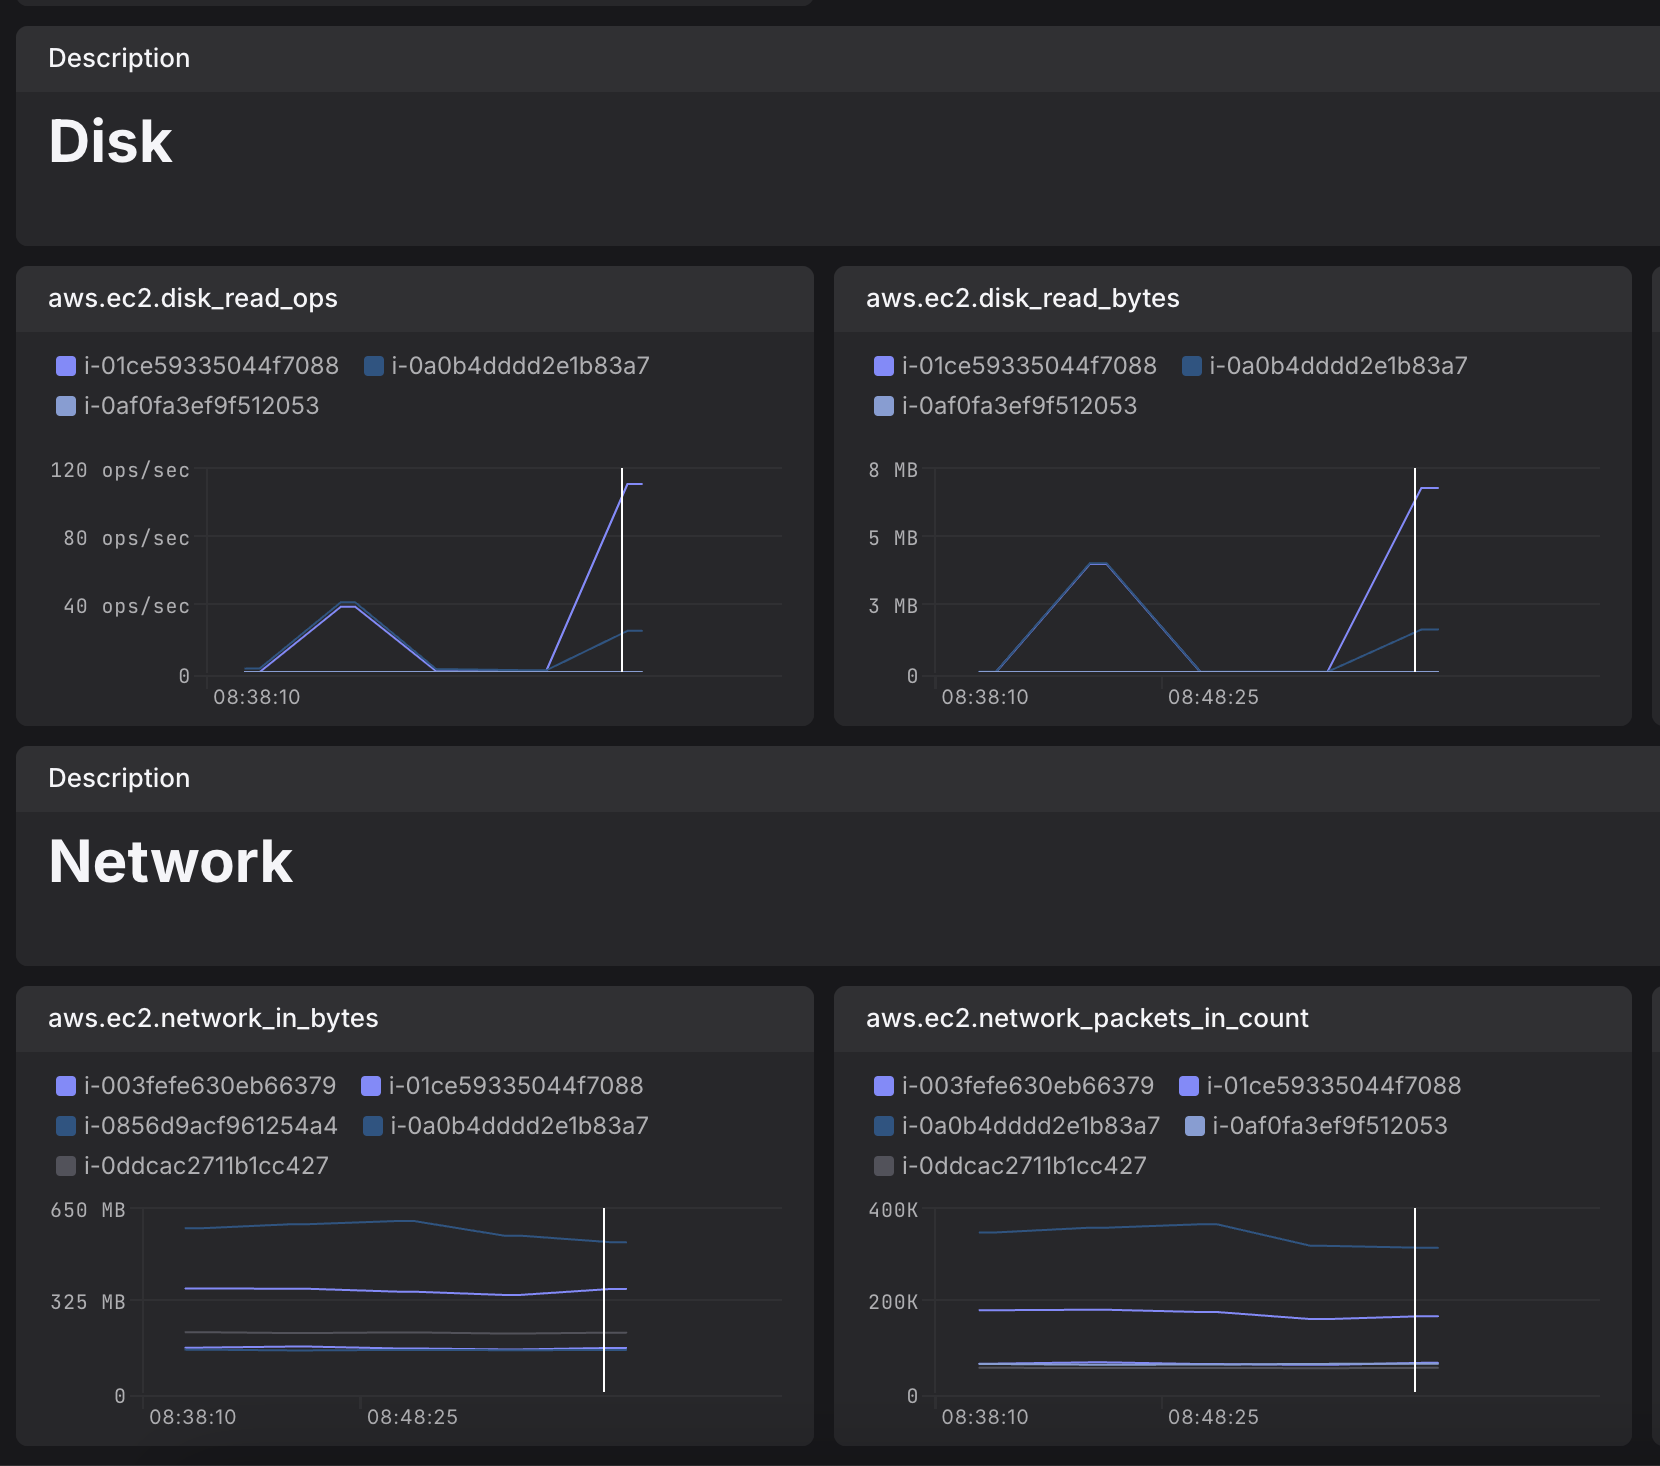
AWS EC2 instance metrics.
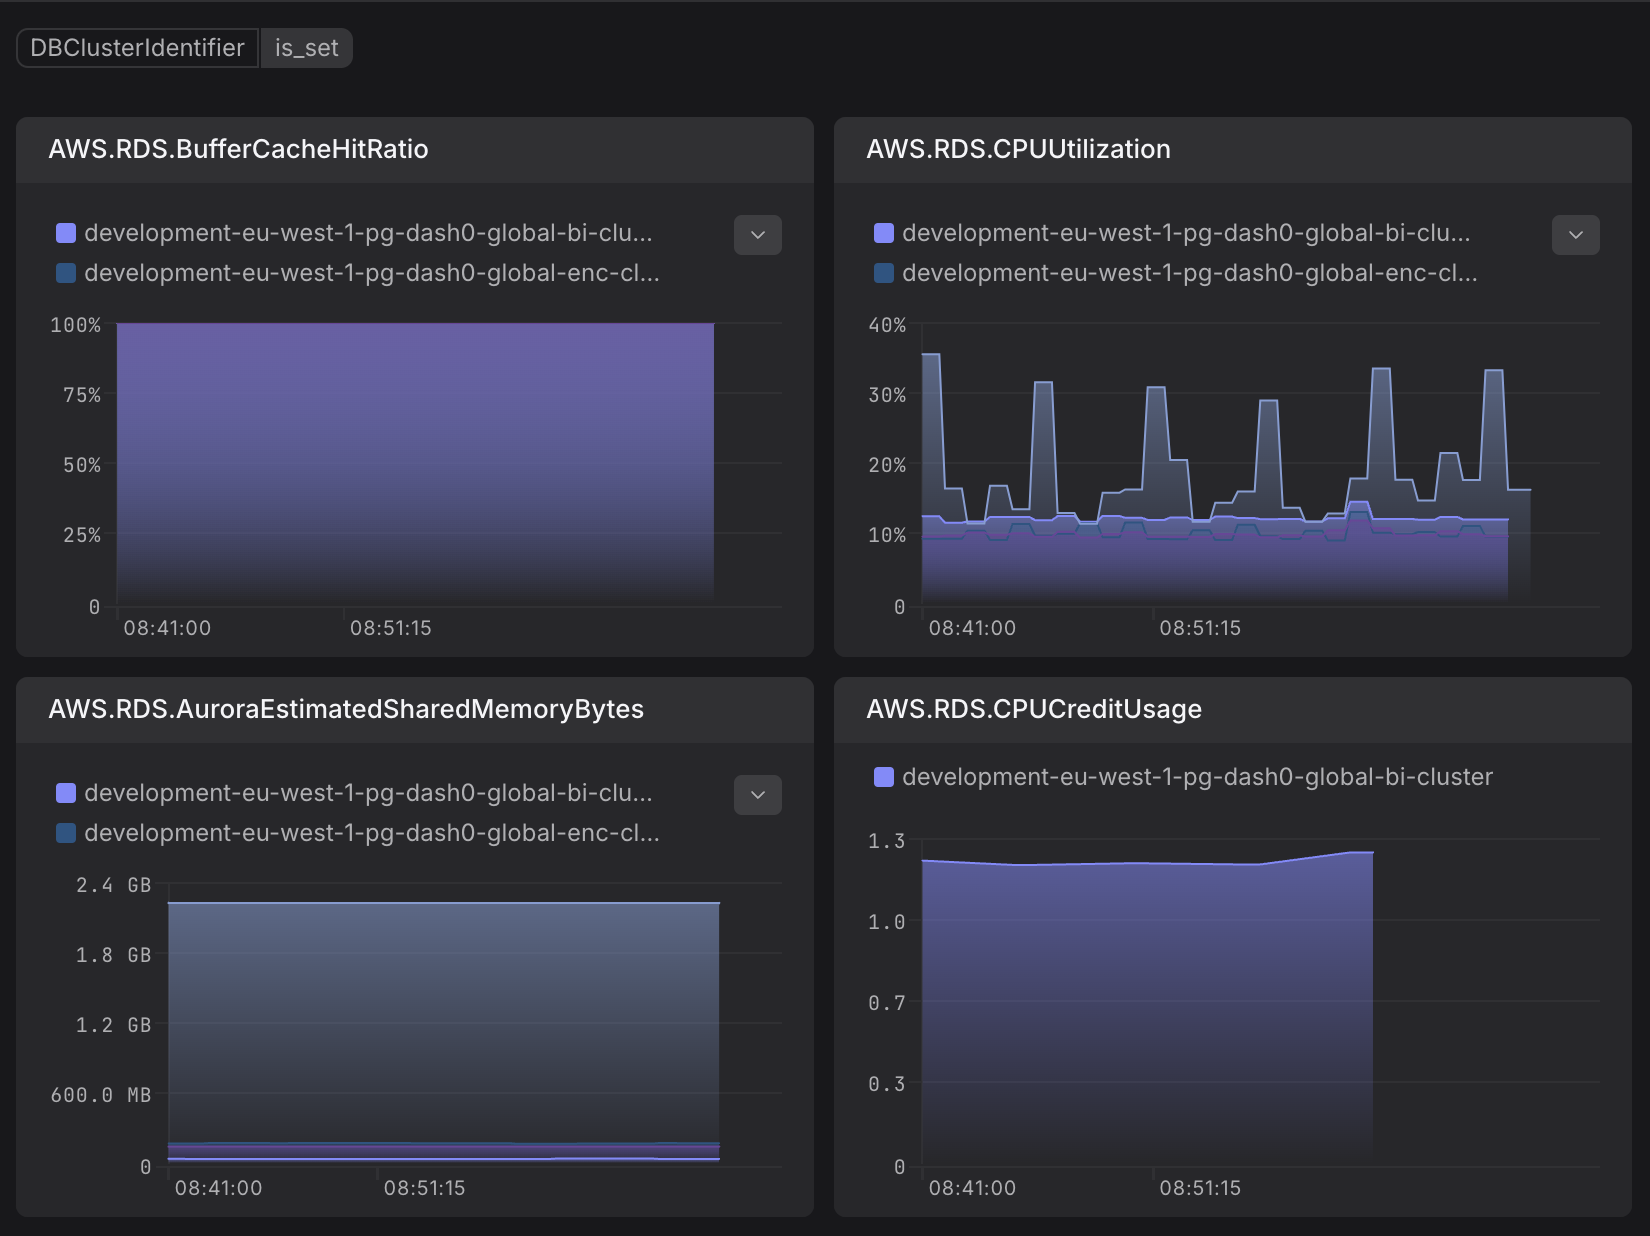
AWS RDS metrics.
AWS EC2 instance failed status check
Alert triggers when EC2 instance EBS status checks fail.
AWS RDS CPU utilization is above 80%
Alert triggers when RDS CPU usage is consistently high.
AWS RDS database connection count is high
Alert triggers when RDS connection count exceeds threshold.
AWS RDS IAM authentication failures detected
Alert triggers when new RDS IAM authentication failures occur within a 5-minute window.
AWS RDS freeable memory is low
Alert triggers when RDS freeable memory is below 256MB.
AWS RDS read latency is high
Alert triggers when RDS read operations take more than 200ms.
AWS RDS replication slot lag is high
Alert triggers when replication lag exceeds 1GB.
AWS RDS instance is using swap memory
Alert triggers when RDS starts using swap memory, indicating memory pressure.
You can create a CloudWatch metric stream and direct it to an Amazon Data Firehose delivery stream. Firehose can then deliver the metrics to Dash0 through an HTTP endpoint. This guide will teach you how.
Follow AWS documentation to create a Firehose delivery stream from AWS console:
1. Choose source and destination
Choose "Direct PUT" as the source and "HTTP Endpoint" as the destination of your Firehose stream.

2. Firehose stream name
Give your Firehose stream a name.
3. Destination settings
In HTTP Endpoint URL, enter AWS CloudWatch Metrics (JSON) via Firehose HTTP endpoint, which can be found in your Dash0 organization settings under Endpoints:
Create a Dash0 authentication token for the Firehose stream. It is recommended to grant only the ingestion permission to this token.
In the authentication section, you can either choose "Use access key" option and enter the authentication token directly as the Access Key:
or use AWS Secrets Manager to retrieve the token programmatically.
By default, data will be sent to the default dataset. To route data to a specific dataset, you have two options:
dash0-dataset and your dataset identifier as the value. Make sure the authentication token has ingest permissions for that dataset.You can keep the rest of the settings as default. Optionally, you can enable GZIP encoding to compress the data.
4. Backup settings
Create or choose an existing S3 bucket to store data in case of delivery failures.
Follow AWS documentation to create a CloudWatch metric stream that sends selected metrics in JSON to your Firehose delivery stream previously created.
1. Choose destination
Choose Custom setup with Firehose and select the Amazon Data Firehose stream created in the previous step.
2. Change output format
Choose JSON as the output format.

CloudWatch supports exporting metrics in both JSON and OpenTelemetry 1.0 format. We have tested sending metrics in both formats to Dash0 and found that metrics exported in JSON format have more structured resource attributes that are easier to query. Therefore, we require using the JSON format. Choosing OpenTelemetry 1.0 format will lead to delivery failure in Firehose stream.
3. Select metrics to be streamed
Select the metrics you want to stream to Dash0.
4. Custom metric stream name
Give your CloudWatch metric stream a unique name.
Once everything is set up, you can find CloudWatch metrics in Dash0 Metrics Explorer
by filtering with aws.cloudwatch.metric_stream_name or with your cloud.account.id.
You will see metrics grouped under aws metric namespace.
The metric names have been normalized according to OpenTelemetry naming conventions.
For example, CPUUtilization of EC2 instances becomes aws.ec2.cpu_utilization.
You can create check rules using CloudWatch metrics imported via Firehose. However, be aware that CloudWatch and Firehose introduce buffering delays when delivering metrics to Dash0. These delays may cause alerting issues: when a check rule is evaluated, the most recent metric data may not yet be available in Dash0.
To account for this delay, add an offset clause to your check rule expression. This shifts the query time window backward,
ensuring you query data that has already arrived:
The offset value (e.g., 5m) should be adjusted based on the observed delay in your environment.
