Dash0 Raises $110M Series B at $1B Valuation
Gain full visibility into your ClickHouse data with this managed integration. Dash0 simplifies ClickHouse setup and ongoing management.
ClickHouse is a highly-potent columnar database. If you want to, you can have ClickHouse Inc. run it for you in their cloud. If you are using their offering, you will still want insights into ClickHouse's behavior. To that extent, ClickHouse Cloud exposes metrics for its customers that you can view via Dash0.
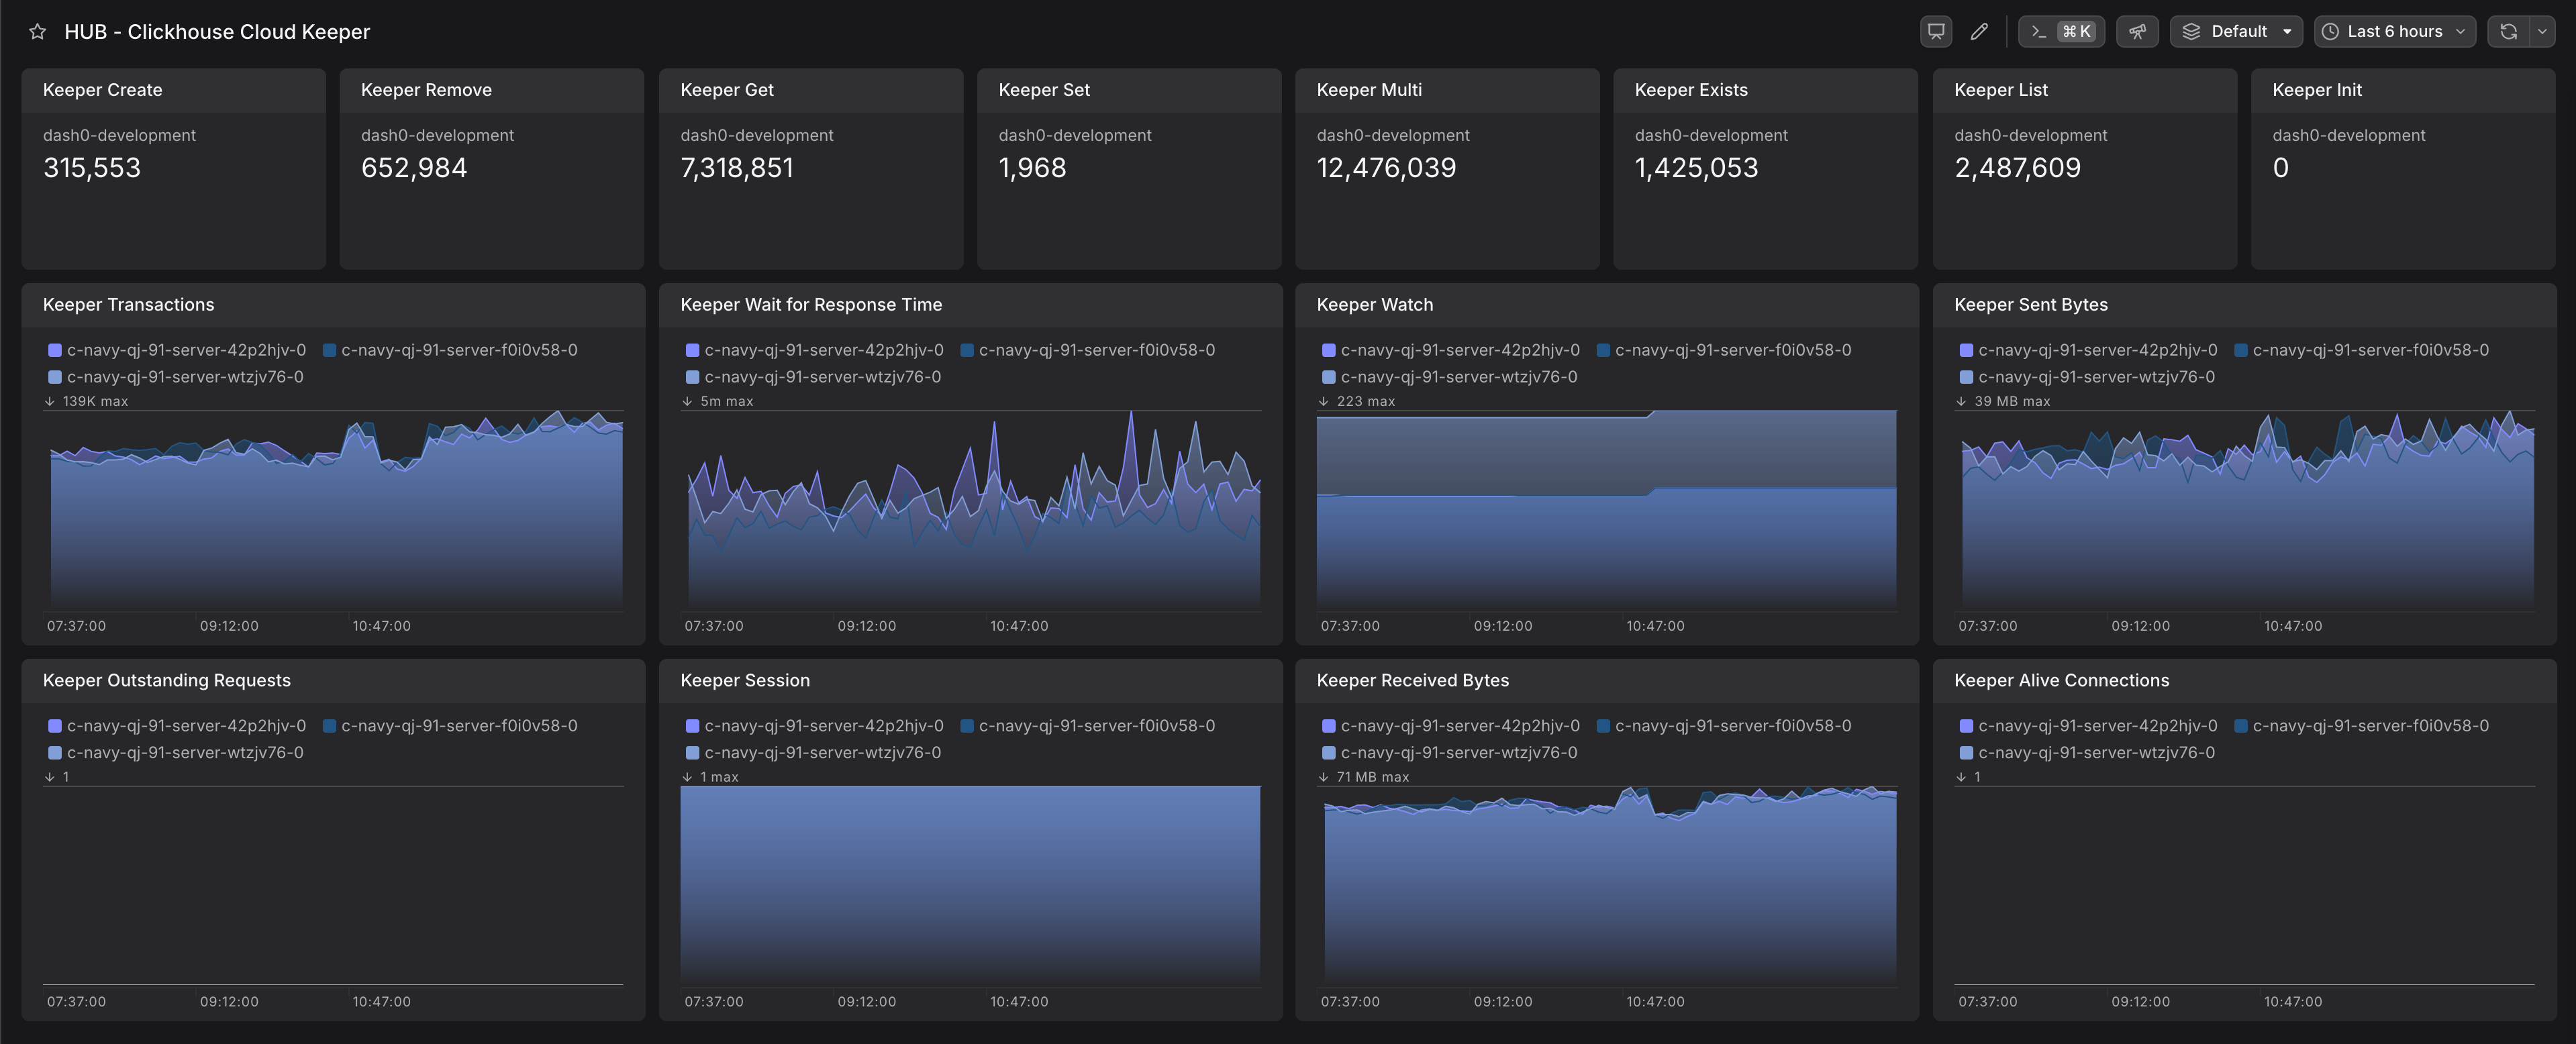
Gain visibility into your ClickHouse data with Keeper integration. Monitor key metrics and system health effortlessly for improved insights.
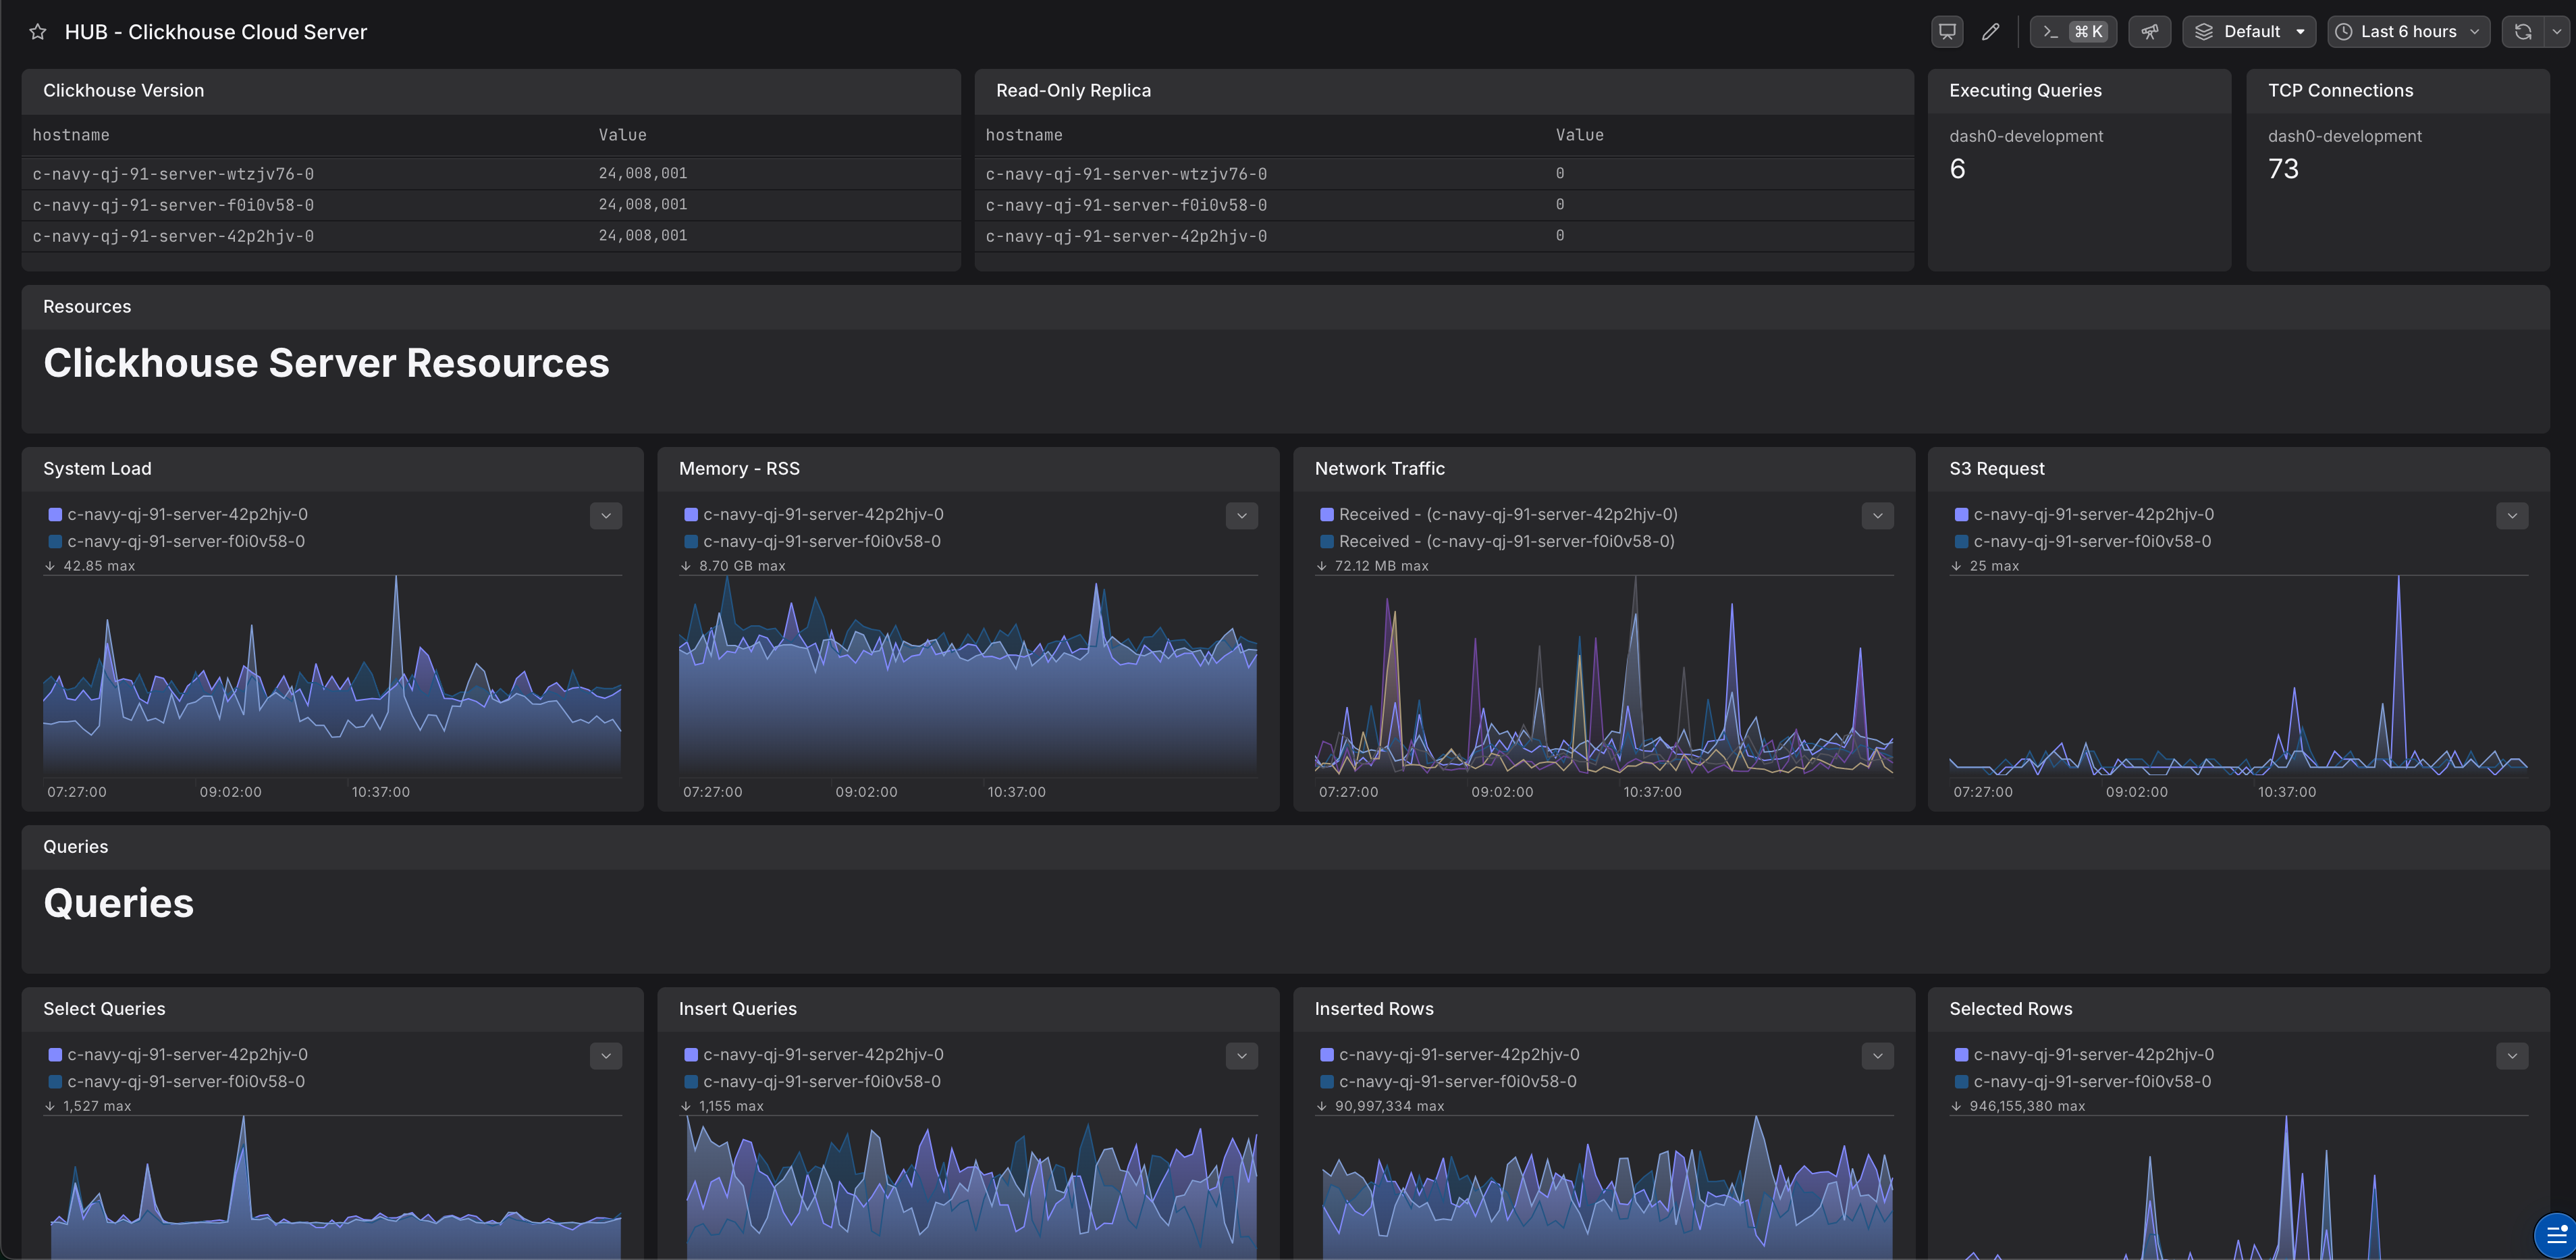
Monitor ClickHouse server (replica) performance with real-time metrics. Gain insights into query execution and system health for optimized analytics.
ClickHouse Cloud exposes metrics through a Prometheus endpoint that you can scrape. We recommend to scrape and forward these metrics via an OpenTelemetry Collector.
To start, you will need a few values and secrets from your ClickHouse Cloud installation. The ClickHouse Cloud documentation
explains how to access these. Once available, store these. In the next step, we will assume that these are exposed
through environment variables. We also recommend to define the name of the environment within an environment variable
called ENVIRONMENT_NAME.
The following code snippet shows an OpenTelemetry Collector configuration file. Be awared that the value of job_name
in the below configuration will be used as server.name attribute value.
Learn how to deploy the collector within our OpenTelemetry collector integration documentation.