Dash0 Acquires Lumigo to Expand Agentic Observability Across AWS and Serverless
Gain visibility into your .NET applications. This integration seamlessly connects with Microsoft's .NET development platform for enhanced insights.
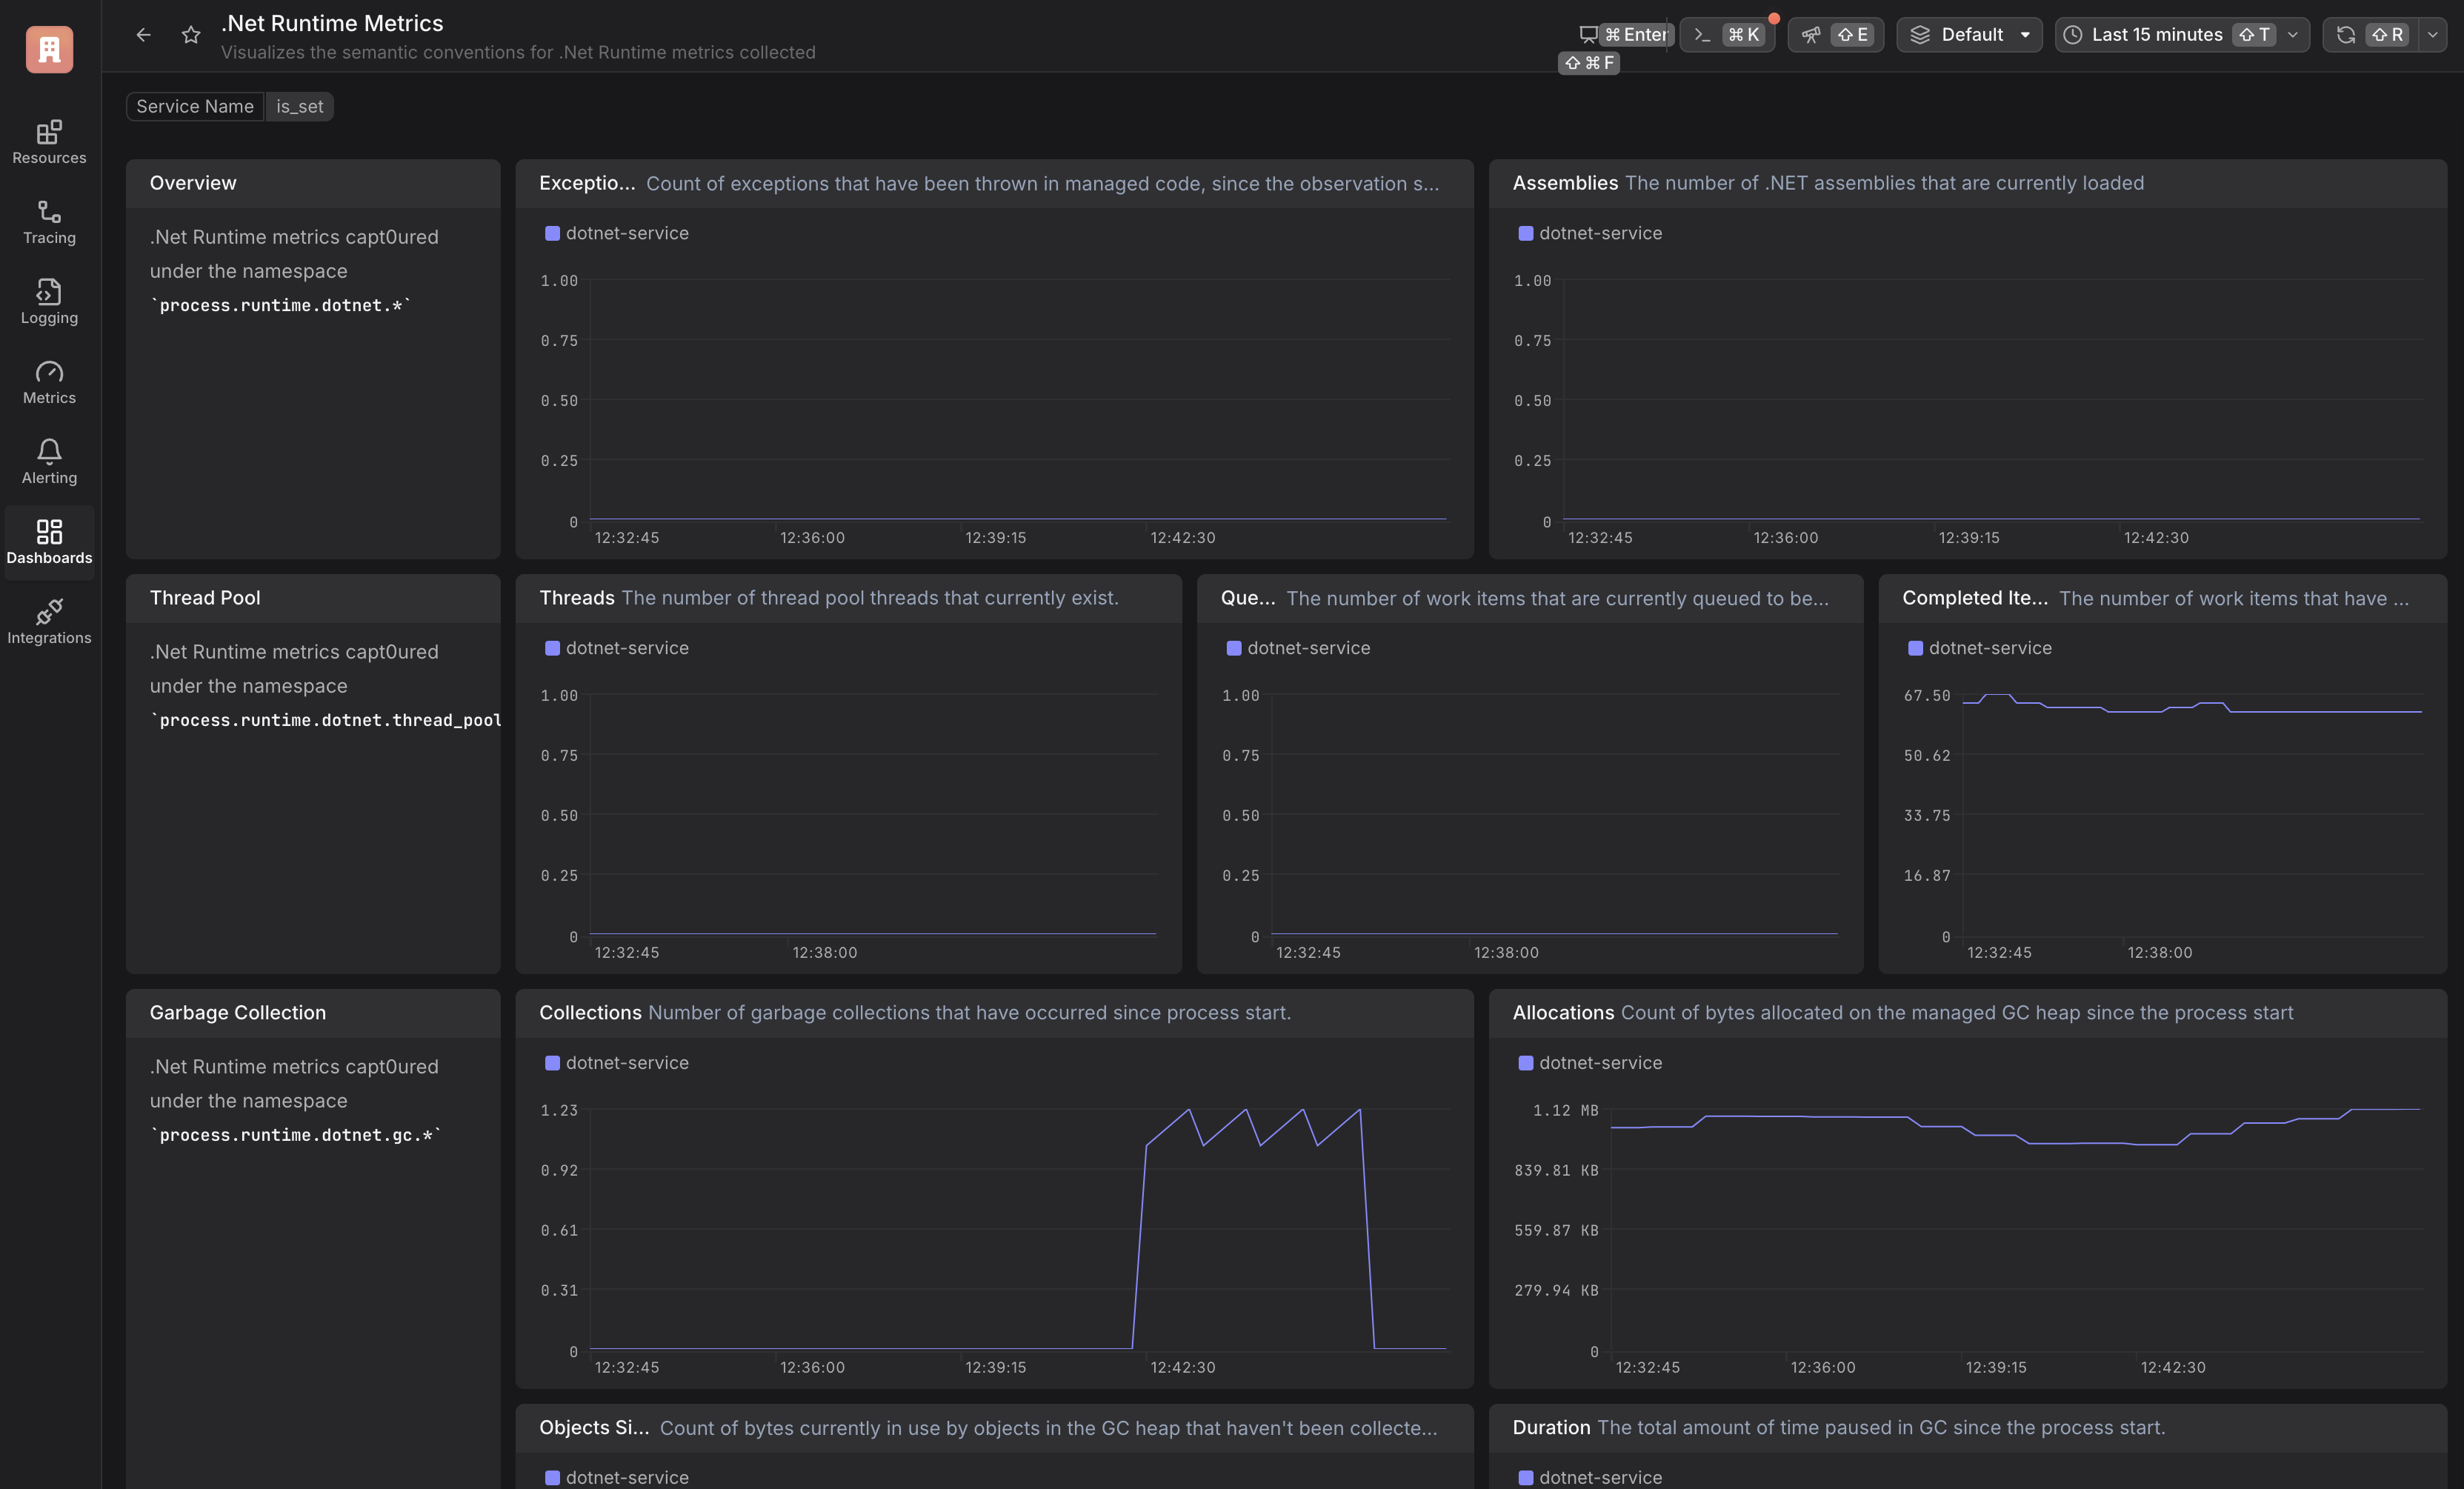
.Net Runtime Dashboard
The Dash0 Kubernetes Operator automatically instruments your .NET and CLR-based workloads. Using the operator is the recommended way of getting visibility into .NET-based Kubernetes workloads, and is preferred over configuring the OpenTelemetry SDK manually for each application.
Instrumenting your .NET applications and services to generate traces, logs, and metrics is a powerful way to gain deep insights into its behavior and performance. By adding instrumentation, you enable your application to emit valuable data that can be used for monitoring, troubleshooting, and optimization.
Dash0 supports automatic instrumentation of .NET applications through OpenTelemetry's open-source and vendor-agnostic packages.
Dash0 has published agent skills that can automate this setup for you!
OpenTelemetry comes with a ready-made auto-instrumentation package for .NET that will kickstart your observability journey. Learn more about the installation process within OpenTelemetry's official documentation.
Note: Currently the OpenTelemetry Auto-instrumentation is not supported on Apple Silicon. For more details, see the compatibility guide.
The steps below is for Linux. If you are on a Windows computer, check out the official guide using Powershell here.
1. Download the latest installation script
2. Execute the installation script
3. Execute the script for configuring your environment
Most auto-instrumentation in OpenTelemetry can be configured using environment variables. Specify the following variables to automatically apply the auto-instrumentation package and send data to your Dash0 environment:
1. Specify the application service name:
Replace my-first-observable-dotnet-service with a meaningful name that identifies your application.
2. Set up the data export endpoint and authorization token:
Note: You can specify which dataset to send data to by adding the Dash0-Dataset header. For example:
For more information, see the dataset documentation.
In case you are not using the Dash0 operator for Kubernetes to deploy your application, you should extend the OpenTelemetry resource attributes to include the Pod UID. This is important to merge the resources between logs,traces and metrics. You can do this by adding the following environment variables to your deployment:
This will add the k8s.pod.name and k8s.pod.uid attributes to the OpenTelemetry resource attributes, which will be included in all telemetry data sent to Dash0.
To read more about resource equality and merging, please refer to the Dash0 docs.
In order to learn more about the importance of resource attributes read the blog post OpenTelemetry resource attributes: Best practices for Kubernetes
To understand which libraries are automatically instrumented by this package, please refer to the OpenTelemetry documentation.