Dash0 Raises $110M Series B at $1B Valuation
Dash0's Istio integration provides visibility into your systems with service mesh and open-telemetry monitoring.
Istio is one of the most commonly used service meshes. Istio configures Envoy instances under the hood and handles networking for you. Service meshes are somewhat complex, and visibility into their activity can be the difference between easy troubleshooting and a long-winded analysis.
Enhance observability and gain actionable insights into Istio-managed services:
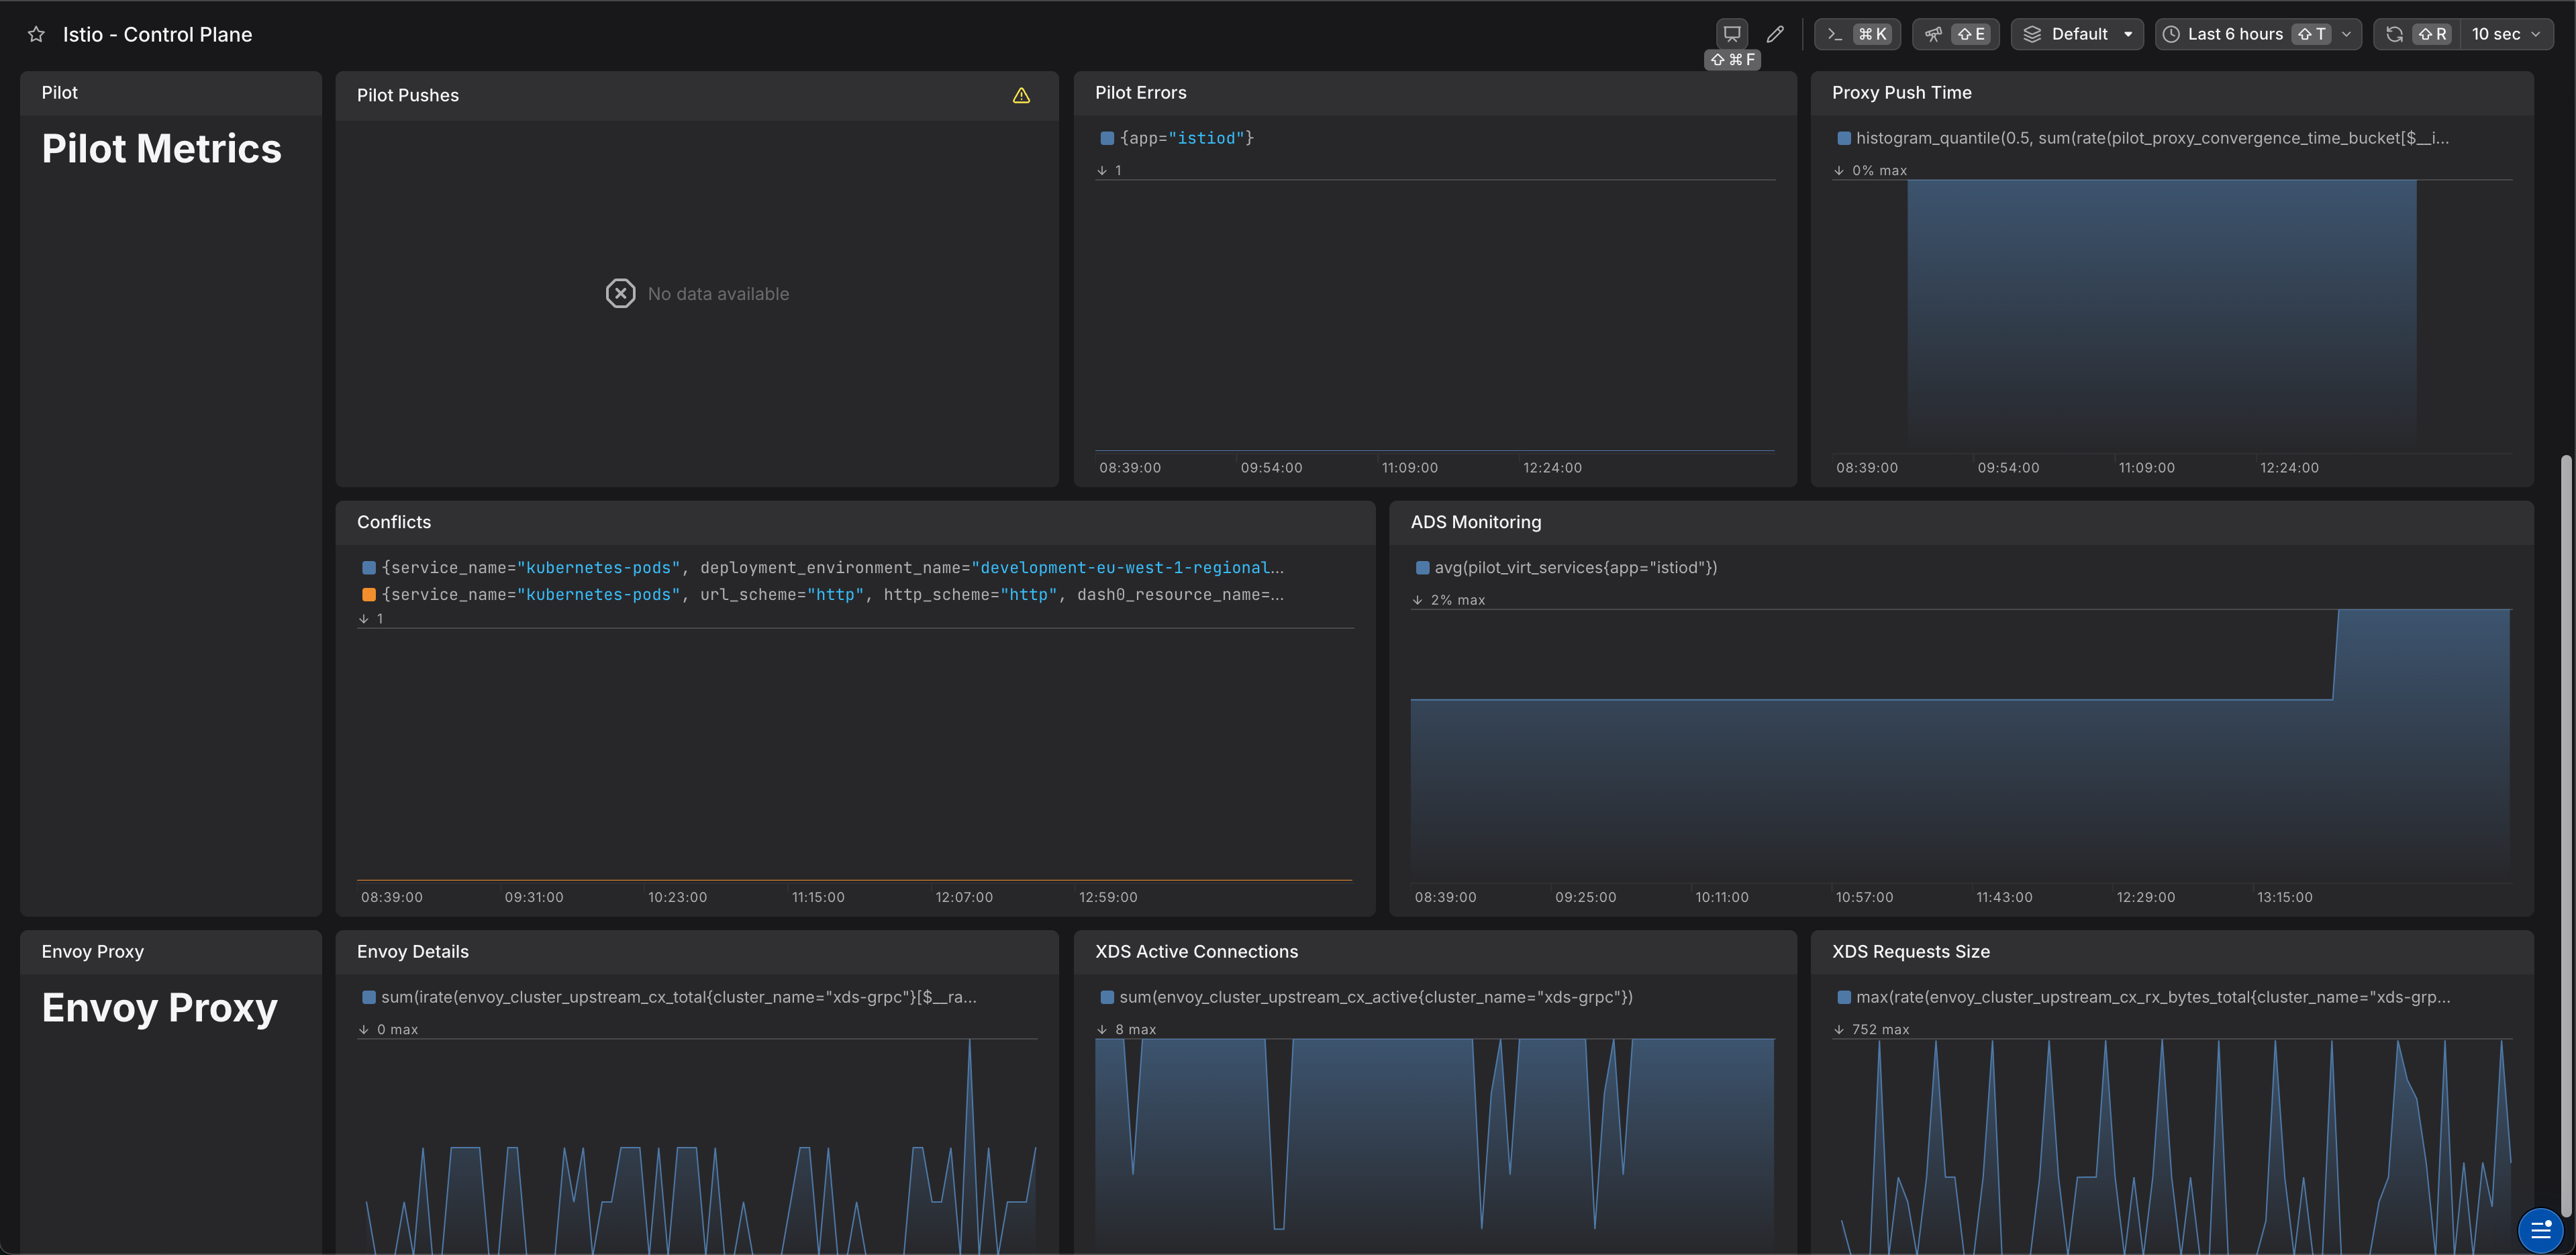
Istio control plane components metrics
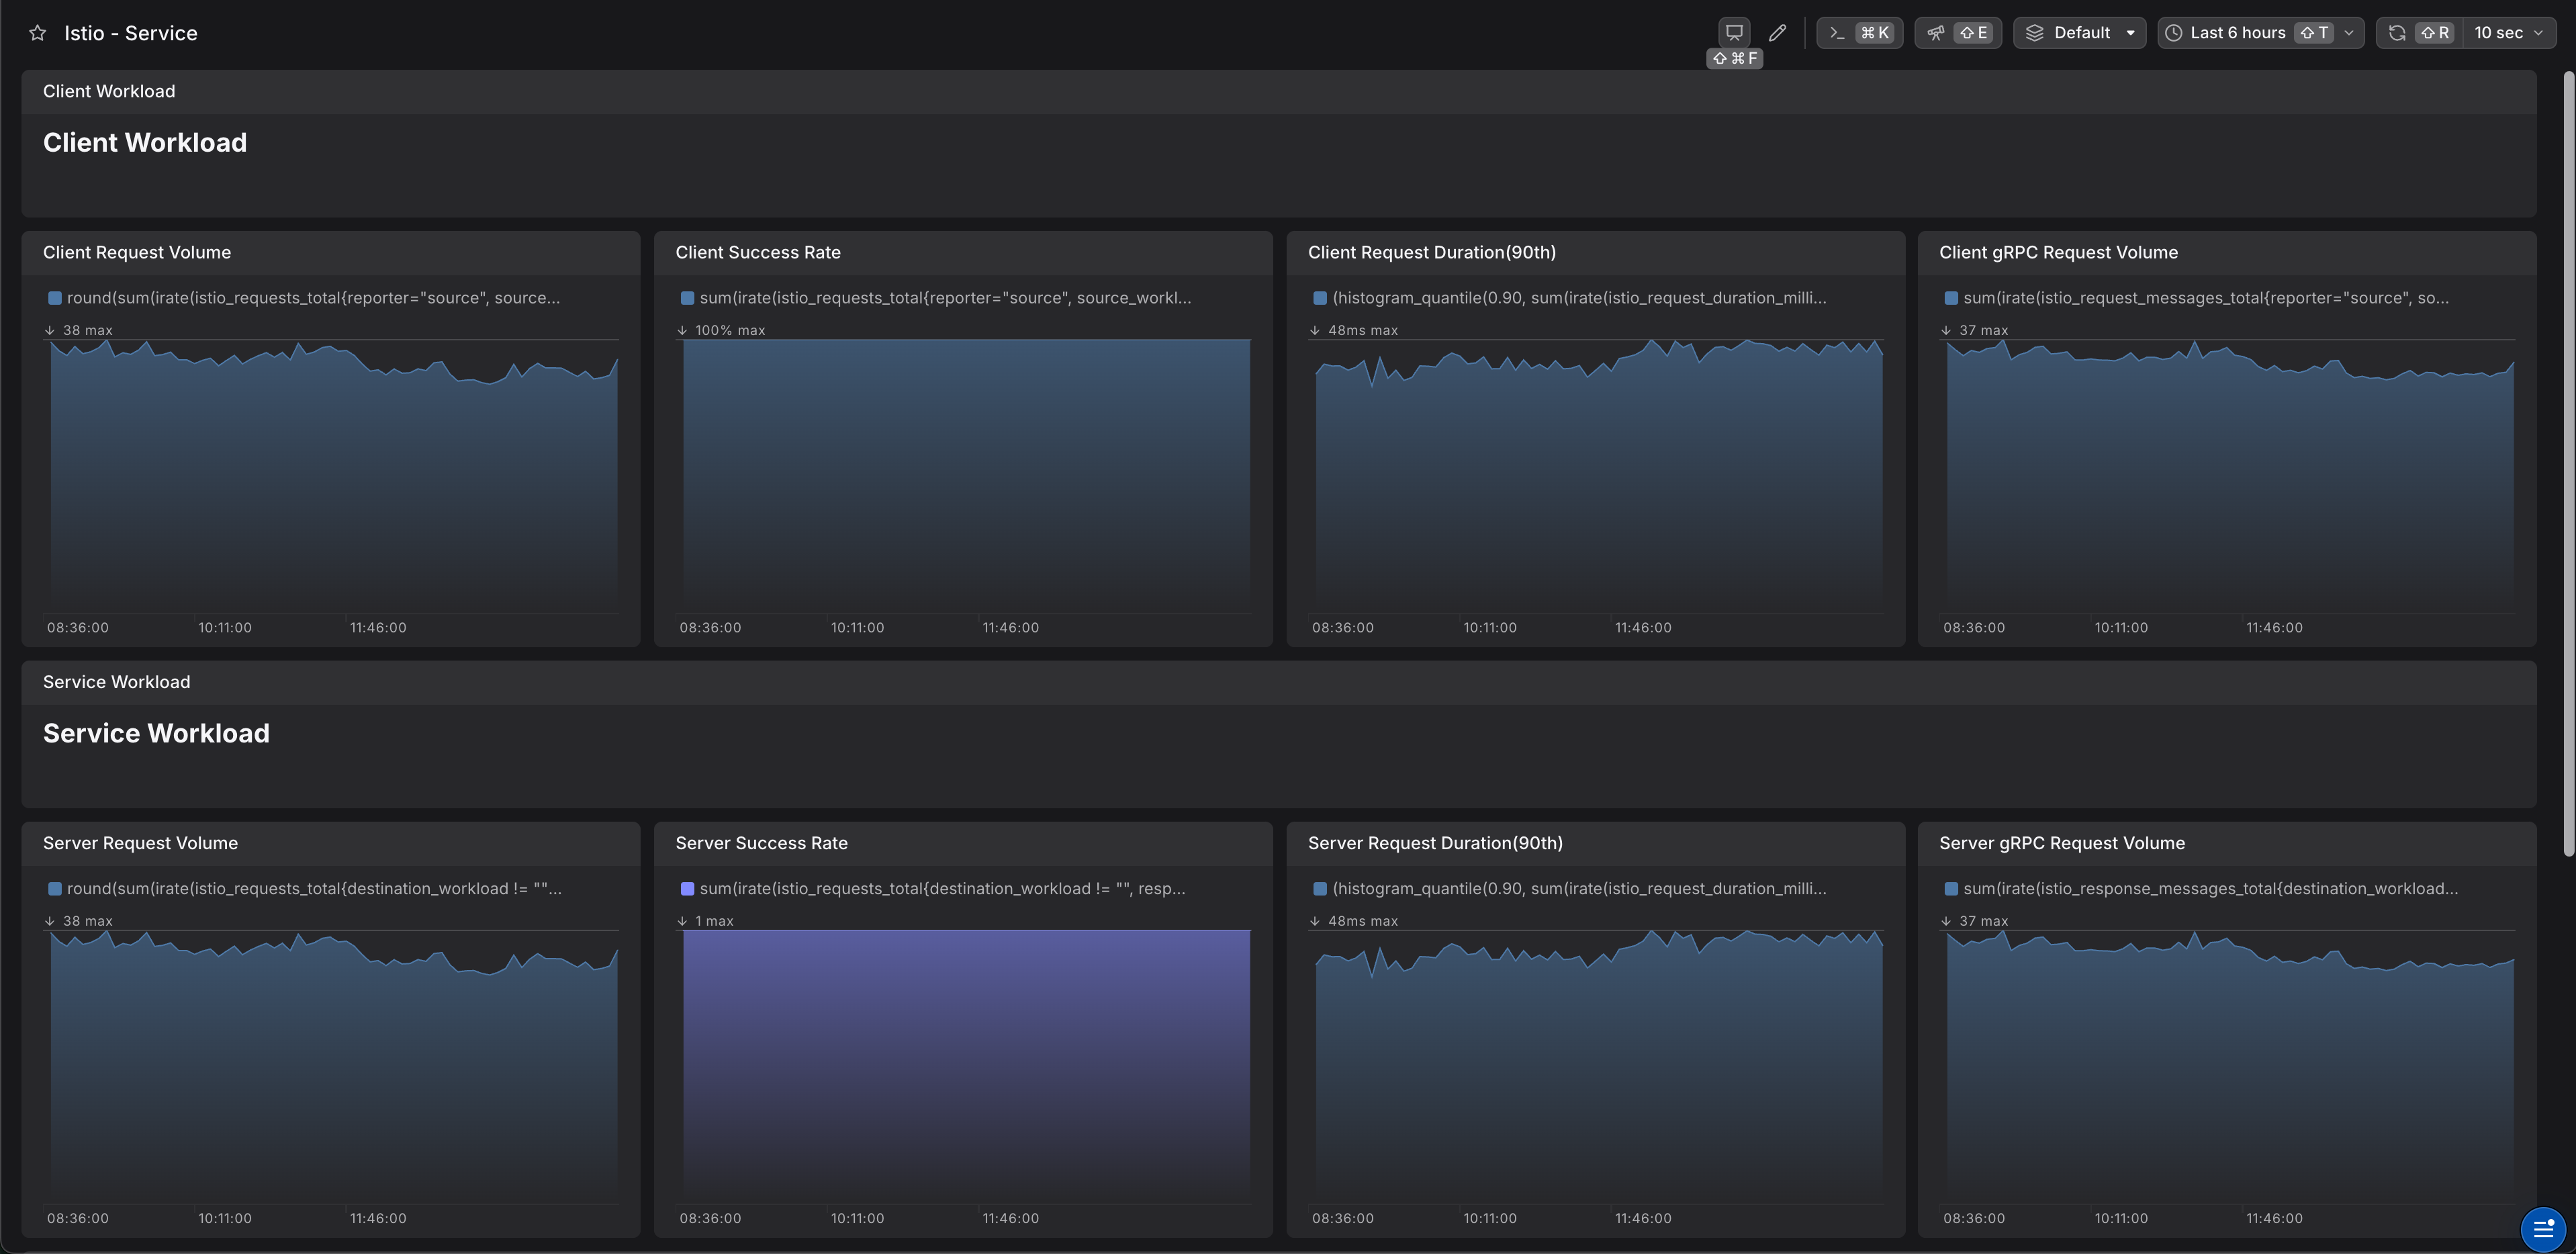
Istio service mesh traffic metrics
Istio Citadel failing to rotate certificates
Alert triggers when certificate signing request failures occur.
Istio Galley failing to validate configurations
Alert triggers when Galley configuration validation failures occur.
Istio control plane having cluster management issues
Alert triggers when istiod loses visibility of remote clusters.
Istio control plane component is down
High percentage of HTTP 4xx responses in Istio (above 5%)
High percentage of HTTP 5xx responses in Istio (above 5%)
Istio control plane high memory usage
Alert triggers when Istio control plane memory usage exceeds 1GB.
High 5xx error rate between Istio services
High 5xx error rate ({{ $value }}%) from {{ $labels.source_service_name }} to {{ $labels.destination_service_name }} in namespace {{ $labels.destination_service_namespace }}.
Alert triggers when 5xx error rate exceeds 5% between any two services.
High P99 latency between Istio services
High P99 latency ({{ $value }}ms) from {{ $labels.source_service_name }} to {{ $labels.destination_service_name }} in namespace {{ $labels.destination_service_namespace }}.
Alert triggers when P99 latency exceeds 1 second between services.
Global request rate in the service mesh is unusually high
Istio ingress gateway experiencing high error rates
Alert triggers when ingress gateway error rate exceeds 10%.
Gateway pods have dropped — inbound traffic will likely be affected
Istio 1% slowest requests are longer than 1000ms
Global request rate in the service mesh is unusually low
Services not using mTLS in Istio service mesh
Alert triggers when services communicate without mutual TLS.
Istio Pilot failing to configure proxies
Alert triggers when Pilot XDS configuration push error rate is high.
Istio pilot duplicate entry error
Envoy proxy connection failures
Istio proxy sidecar experiencing connection terminations
Alert triggers when Istio proxies frequently lose connection to control plane.
Istio sidecar injection failures
Unusual traffic volume detected in Istio service mesh
Alert triggers when traffic volume changes significantly compared to previous hour.
Istio workload certificates expiring soon
Alert triggers when workload certificates expire within 7 days. NOTE: This query needs to be updated with proper certificate expiry metrics when available.
Istio has native support for the generation of OpenTelemetry sigals:
Perfect for the integration with Dash0.
The best practice is using an opentelemetry collector instead of sending telemetry to backend (Dash0) directly. An easy way is using opentelemetry-collector helm chart.
Before deploying the OpenTelemetry Collector, create a secret in the monitoring namespace to store your Dash0 Authorization Token:
This secret allows the OpenTelemetry Collector to authenticate with Dash0 and send telemetry data.
An example of values.yaml file would be
Istio exposes metrics in default via annotations:
With an OpenTelemetry collector as shown above we can scrape and export metrics to Dash0. See istio prometheus integration.
You need to add an extensionProvider and enable tracing.
Next, enable tracing:
An istio service entry for the OpenTelemetry collector service is normally required. Make sure the port name starts with grpc-