Observe programs written in Java and others running on the Java-Virtual Machine (JVM).
The Dash0 Kubernetes Operator automatically instruments your Java and JVM-based workloads. We recommend all Kubernetes users use the operator instead of manually configuring the OpenTelemetry SDKs.
Instrumenting your Java and JVM-based applications to generate traces, logs, and metrics is a powerful way to gain deep insights into its behavior and performance. By adding instrumentation, you enable your application to emit valuable data that can be used for monitoring, troubleshooting, and optimization.
Dash0 supports automatic instrumentation of Java applications through OpenTelemetry's open-source and vendor-agnostic libraries.
The OpenTelemetry Java SDK provides a ready-made auto-instrumentation agent that simplifies instrumentation:
The opentelemetry-javaagent.jar file contains both the agent and instrumentation libraries, enabling automatic instrumentation of your JVM-based application without modifying its source code.
To send data to Dash0, configure the following settings:
1. Register the OpenTelemetry Java Agent
Ensure that the OpenTelemetry Java agent is registered when starting your application by using the -javaagent parameter:
Alternatively, you can set an environment variable to automatically add the -javaagent parameter to the JVM:
2. Specify the application service name:
Replace my-first-observable-java-service with a meaningful name that identifies your application.
3. Set up the data export endpoint and authorization token:
Note: You can specify which dataset to send data to by adding the Dash0-Dataset header. For example:
For more information, see the dataset documentation.
To see which libraries are automatically instrumented, refer to the OpenTelemetry registry.
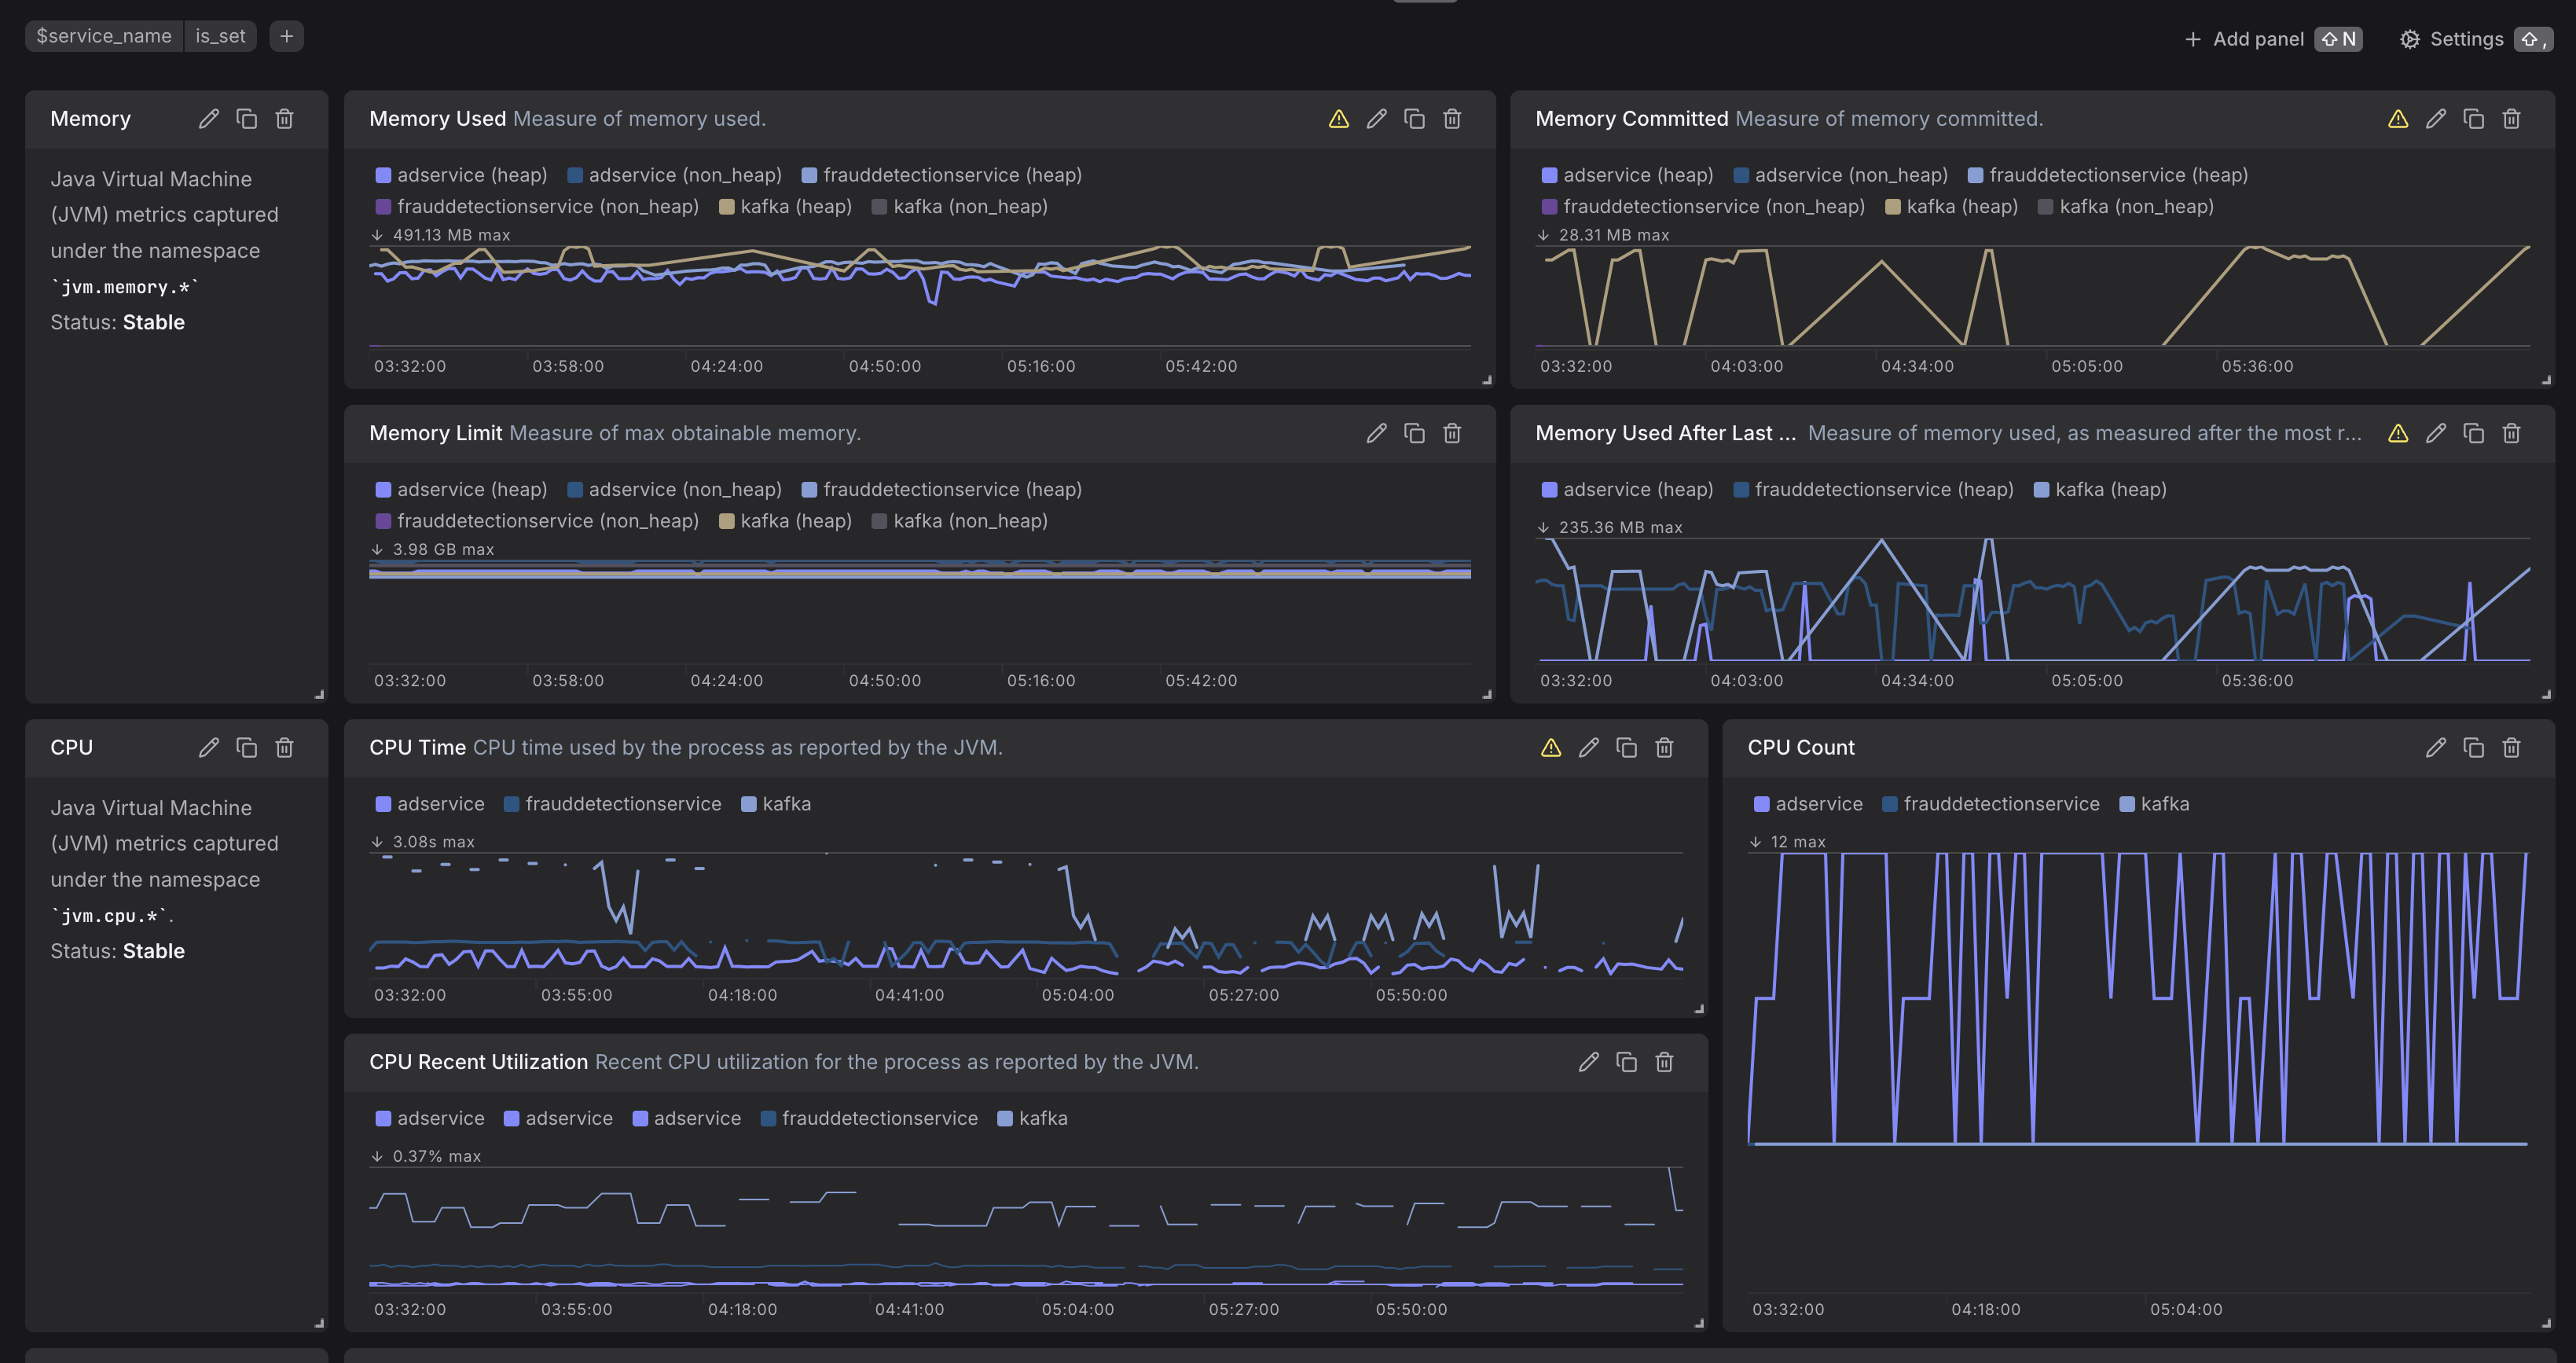
JVM Metrics Dashboard