Dash0 Raises $110M Series B at $1B Valuation
The OpenTelemetry Collector streamlines telemetry data collection, processing, and export across diverse systems for enhanced visibility.
The OpenTelemetry Collector is a vendor-agnostic observability pipeline component that collects, processes, and exports telemetry data. As an official CNCF project, it provides open-source tools to enhance monitoring and observability capabilities. Dash0’s native integration with OpenTelemetry enables seamless telemetry data handling and insight generation to improve operational efficiency.
Empower your observability with the Dash0 integration for OpenTelemetry, enabling value-driven insights and streamlined telemetry workflows:
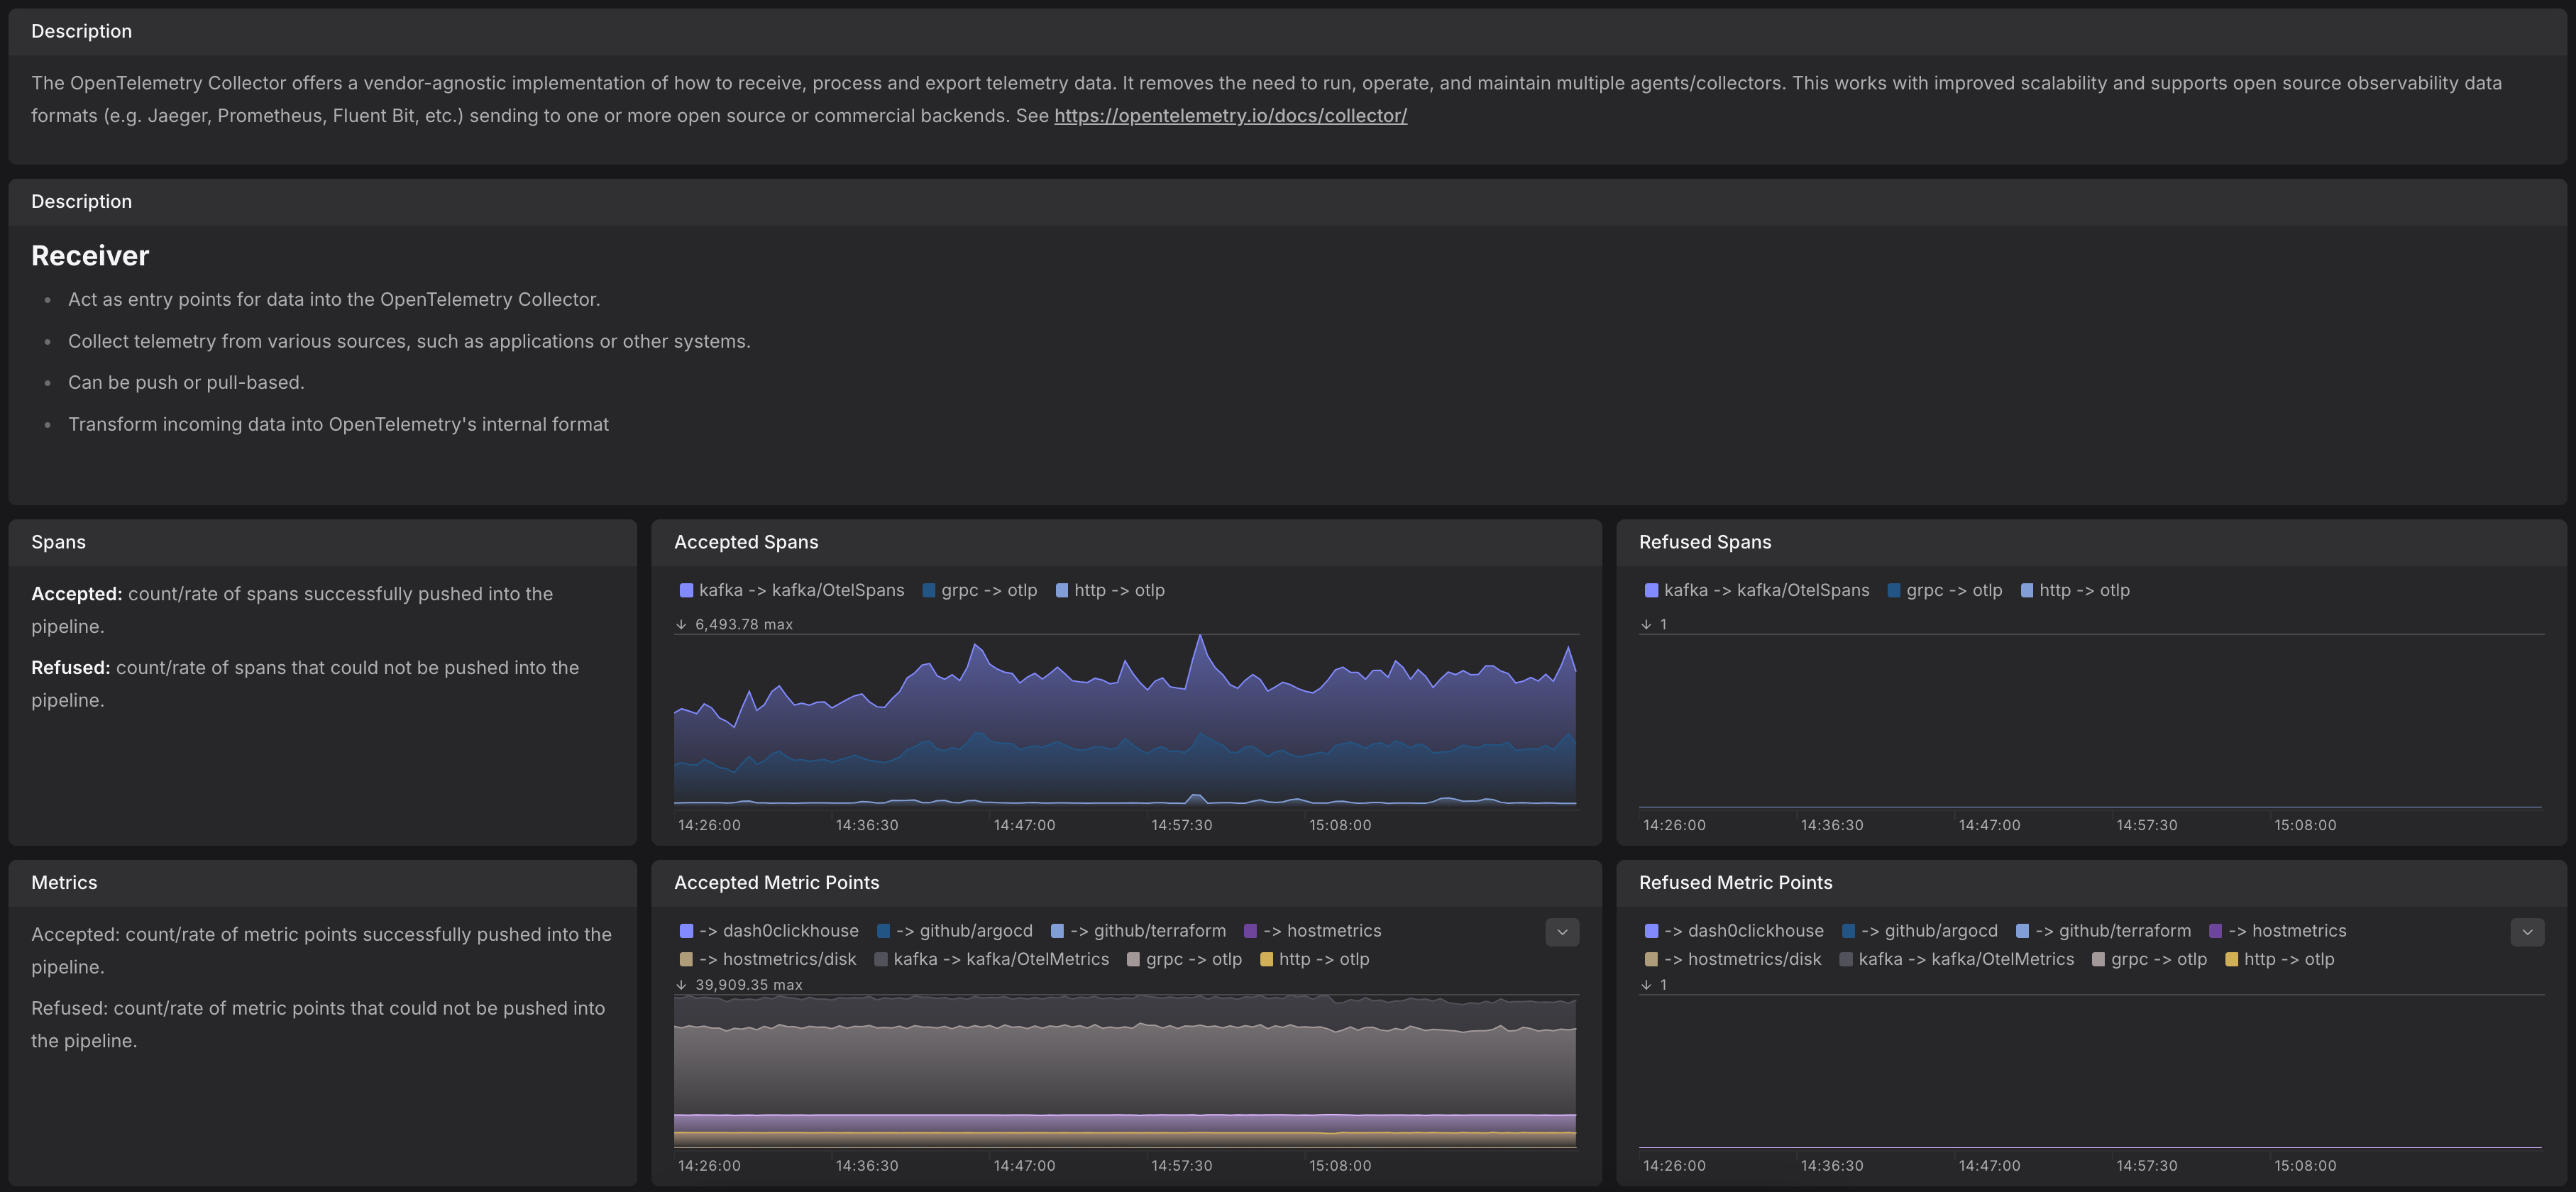
Detailed metrics for the OpenTelemetry Collector processing pipeline covering receiver, processor, and exporter metrics.
OpenTelemetry Collector export operations are failing
Monitors OpenTelemetry Collector metric export failure rate over 5 minutes. This alert fires when the rate of failed metric exports exceeds the threshold:
OpenTelemetry Collector memory usage is high
Monitors OpenTelemetry Collector memory usage in MB. This alert fires when the collector's RSS memory exceeds the threshold:
OpenTelemetry Collector log export operations are failing
Alert triggers when log export failures exceed 10/sec.
OpenTelemetry Collector export queue is nearly full
Alert triggers when export queue utilization exceeds 80%.
OpenTelemetry Collector receiver operations are failing
Alert triggers when receiver refusals exceed 10/sec.
OpenTelemetry Collector span export operations are failing
Alert triggers when span export failures exceed 10/sec.
1. Create a namespace First, create the namespace where you want to deploy the Collector. In this example, we use opentelemetry:
2. Create the Dash0 Authorization Secret Next, create a Kubernetes secret containing your Dash0 authorization token. The token can be found in the organization settings: "Auth Tokens".
3. Configure the helm chart It is recommended to deploy the OpenTelemetry Collector in two modes:
daemonset: For node-level telemetry (e.g., logs, kubelet metrics)deployment: For cluster-wide telemetryNode-level Collector (daemonset)
Copy the configuration below into a file called: daemonset-values.yaml
To see the fully rendered configuration for the node-level collector visually, go to:
Cluster-wide Collector (deployment)
Save the following configuration into a file named deployment-values.yaml:
To see the fully rendered configuration for the cluster-wide collector visually, go to:
For additional configuration options, see the default values.yaml file.
4. Install the OpenTelemetry Collectors Use the following commands to install both OpenTelemetry Collectors into your cluster:
To preview the resources that will be created before applying them, use (for the deployment configuration change the values to match the above):
This will output all Kubernetes resources, including the full OpenTelemetry Collector configuration.
To configure the OpenTelemetry Collector to output its own logs in JSON format, use the following configuration:
For more information, see the docs at https://opentelemetry.io/docs/collector/configuration/#telemetry.
By default, telemetry data is sent to the default dataset in Dash0. To route data to a different dataset, modify the Dash0-Dataset header in the exporter configuration: