
Last updated: July 28, 2026
OpenTelemetry Tracing in Node.js (Complete Guide)
Distributed tracing captures the complete journey of a request as it moves through every service it touches. Each operation is recorded as a span, including its timing, status, and relevant contextual attributes.
OpenTelemetry is the standard framework for producing this data and its Node.js SDK allows you to instrument your application automatically and start collecting traces with minimal setup.
In this guide, you'll instrument a two-service Node.js application from scratch. You'll begin with auto-instrumentation to establish baseline visibility, then refine it using environment variables and SDK configuration. Finally, you'll add manual spans to capture business logic that auto-instrumentation cannot observe.
As you progress, you'll use the collected traces to uncover and fix performance problems in your code. By the end, you'll know how to produce traces that help you debug production systems.
If you're new to distributed tracing, our guide on how distributed tracing works in microservices introduces the core concepts. For a deeper look at how OpenTelemetry tracing works at the instrumentation level, see our dedicated explainer.
Prerequisites
- Docker and Docker Compose
- Node.js 24+ and npm
- A terminal and a browser
- Basic familiarity with Express and REST APIs
Setting up the demo application
The application you'll instrument is a URL shortener called Snip. It consists of two Node.js services backed by PostgreSQL and Redis:
-
Shortener is the public-facing service that accepts URLs from users, fetches metadata (title and description) from the target page, stores everything in PostgreSQL, caches the mapping in Redis, and serves a web UI. When a user visits a short URL, this service proxies the request to the Redirector.
-
Redirector resolves short codes to original URLs. It checks Redis first, falls back to PostgreSQL on a cache miss, records visit analytics (including IP geolocation via the free ip-api.com service), and returns the original URL to the Shortener, which issues the redirect to the client.
This architecture means a single redirect request flows through both services, hitting Redis, PostgreSQL, and an external API along the way. That's exactly the kind of multi-hop, multi-dependency flow where distributed tracing earns its keep.
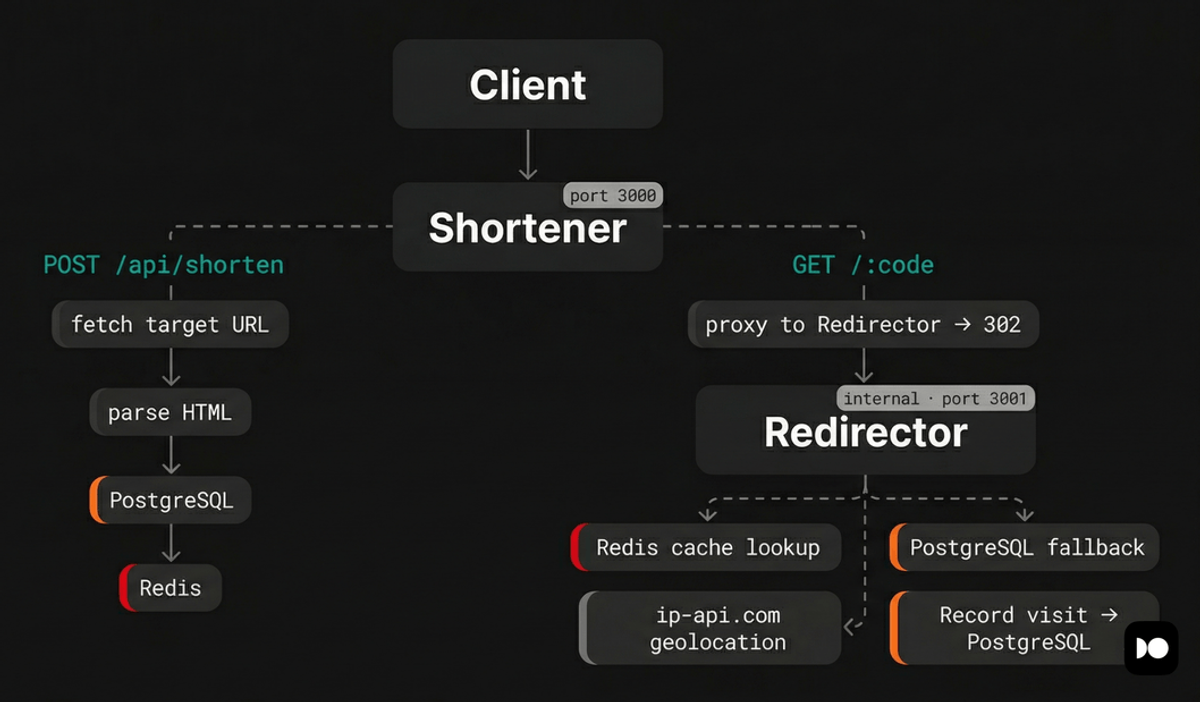
Clone the repository, then change into the project directory:
1git clone https://github.com/dash0hq/dash0-examples/ && cd dash0-examples/nodejs-tracing-starter
At the project root, rename .env.example to .env:
1mv .env.example .env
The .env file is populated with default values that configure the database
credentials, service ports, and internal service URLs:
12345678POSTGRES_USER=postgresPOSTGRES_PASSWORD=postgresPOSTGRES_DB=shortenerDATABASE_URL=postgres://postgres:postgres@db:5432/shortenerREDIS_URL=redis://redis:6379SHORTENER_PORT=3000REDIRECTOR_PORT=3001REDIRECTOR_URL=http://redirector:3001
Now start the services:
1docker compose up -d --build
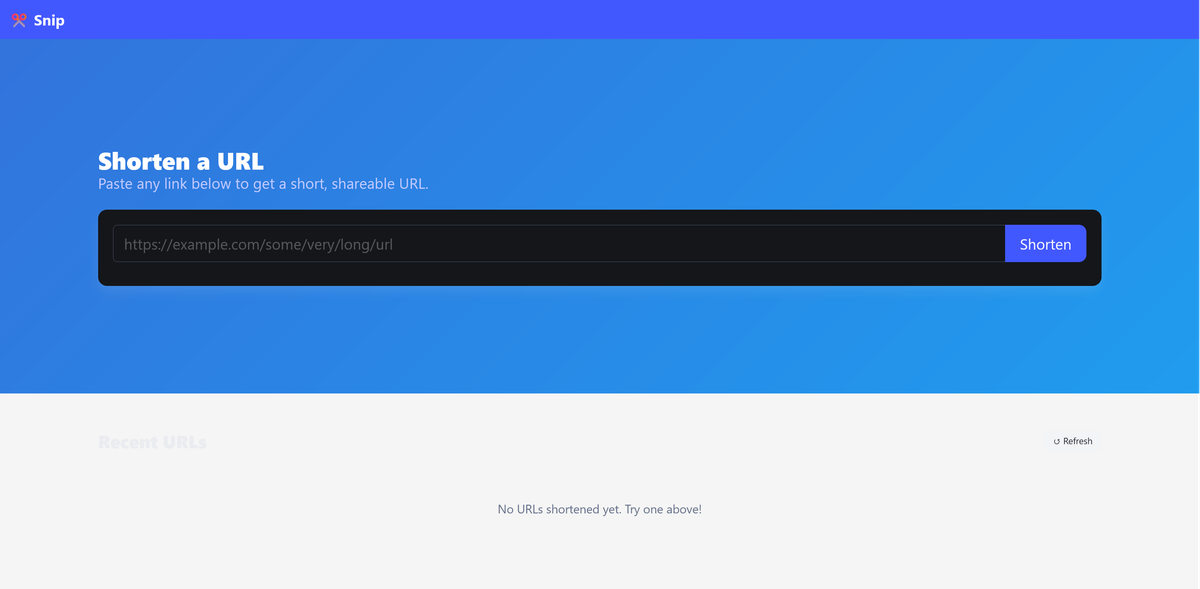
Once all containers are healthy, open http://localhost:3000 in your browser to
see the Snip UI:
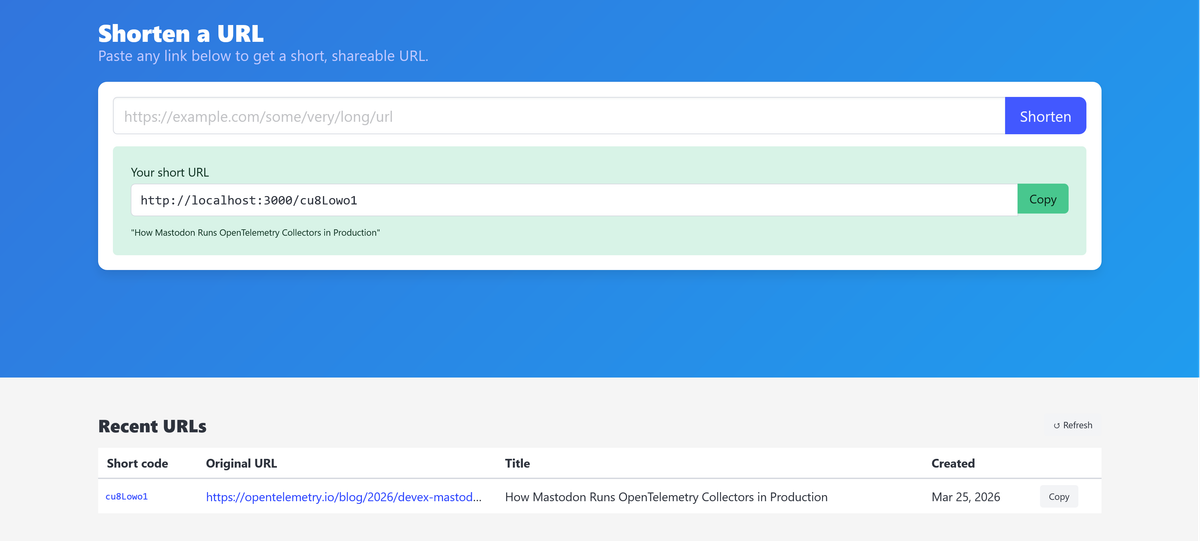
Paste a URL like https://opentelemetry.io/blog/2026/devex-mastodon/ and click
Shorten. The app fetches the page title and description, generates a short
code, and displays the short URL:
Click the short code in the Recent URLs table (or visit it directly) to trigger a redirect. The Shortener proxies the request to the Redirector, which resolves the short code, records the visit, and sends back the original URL. The Shortener then issues a 302 redirect to the browser.
Everything works but you have no visibility into how these services and their dependencies actually interact to produce that result. If a redirect takes five seconds instead of fifty milliseconds, you can't tell which of the operations in the chain caused the delay.
You'll fix that in the next section with OpenTelemetry's zero-code instrumentation.
Auto-instrumentation gives you visibility without code changes
Before writing any tracing code, it's worth understanding how far OpenTelemetry's auto-instrumentation can take you, because for most Node.js applications, it's surprisingly far.
OpenTelemetry provides auto instrumentation libraries for popular Node.js
packages like Express, pg, redis, undici (Node's built-in fetch), and many
others. When loaded before your application code, these libraries monkey-patch
the modules they target to automatically create spans for their operations.
Every inbound HTTP request, every database query, every cache command, and every
outbound fetch() call gets traced without you writing a single line of
instrumentation code.
Auto-instrumentation also handles context propagation across service boundaries.
When the Shortener calls fetch() to reach the Redirector, the instrumentation
automatically injects a
traceparent header
into the outbound request.
On the Redirector side, the SDK extracts this header and continues the same trace. The result is a single distributed trace spanning both services, with no manual wiring required. You'll see exactly how this works once the traces start flowing.
Installing the necessary packages
To get started, you only need to install two packages, set a few environment variables, and let the SDK handle the rest:
12npm install @opentelemetry/api \@opentelemetry/auto-instrumentations-node
Here's what each package does:
@opentelemetry/apidefines the tracing interfaces (creating spans, setting attributes, propagating context). It's deliberately separate from the SDK so that libraries can instrument themselves without pulling in the full implementation.@opentelemetry/auto-instrumentations-nodebundles the SDK, the trace provider, and instrumentation for popular Node.js libraries. When loaded before your application code via the--importflag, it patches these libraries to automatically create spans for their operations.
Verifying auto-instrumentation with the console exporter
Let's confirm that auto-instrumentation is working by printing spans to
stdout. Add the following variables to your .env file first:
1234OTEL_TRACES_EXPORTER=consoleOTEL_METRICS_EXPORTER=noneOTEL_LOGS_EXPORTER=noneNODE_OPTIONS=--experimental-loader=@opentelemetry/instrumentation/hook.mjs --import @opentelemetry/auto-instrumentations-node/register
Then reference them in docker-compose.yml for both services. Since each
service needs its own OTEL_SERVICE_NAME, that one stays inline:
123456789101112131415161718192021# docker-compose.ymlservices:shortener:# ... existing config ...environment:# ... existing vars ...OTEL_SERVICE_NAME: shortenerOTEL_TRACES_EXPORTER: ${OTEL_TRACES_EXPORTER}OTEL_METRICS_EXPORTER: ${OTEL_METRICS_EXPORTER}OTEL_LOGS_EXPORTER: ${OTEL_LOGS_EXPORTER}NODE_OPTIONS: ${NODE_OPTIONS}redirector:# ... existing config ...environment:# ... existing vars ...OTEL_SERVICE_NAME: redirectorOTEL_TRACES_EXPORTER: ${OTEL_TRACES_EXPORTER}OTEL_METRICS_EXPORTER: ${OTEL_METRICS_EXPORTER}OTEL_LOGS_EXPORTER: ${OTEL_LOGS_EXPORTER}NODE_OPTIONS: ${NODE_OPTIONS}
NODE_OPTIONS tells Node.js to install OpenTelemetry's module-loading hook and
load the auto-instrumentation registration module before your application code
runs. The loader hook allows OpenTelemetry to intercept supported module
imports, while the registration module initializes the SDK and applies
instrumentation before packages such as Express, pg, Redis, and Undici are
loaded.
Setting OTEL_TRACES_EXPORTER to console directs the SDK to print every
completed span to stdout, while setting the metrics and logs exporters to
none keeps the output focused on traces.
Once you're done, rebuild and restart the containers:
1docker compose up -d --build
Then shorten a URL and follow the redirect to generate some spans. When you check the service logs:
1docker compose logs shortener redirector
You should see span objects printed to the terminal, each containing a name,
traceId, duration, resource, and attributes field. If these objects are
showing up, the SDK is working and auto-instrumentation is active:
1234567891011121314151617181920212223242526272829303132333435{resource: {attributes: {'service.name': 'shortener','process.pid': 19,'process.executable.name': 'node','process.executable.path': '/usr/local/bin/node','process.command_args': [ '/usr/local/bin/node', '/app/shortener/index.js' ],[...]}},instrumentationScope: {name: '@opentelemetry/instrumentation-http',version: '0.214.0',schemaUrl: undefined},traceId: '64e74aaba02ba88664bef3402dfa75d2',parentSpanContext: undefined,traceState: undefined,name: 'GET',id: 'b6a49f7987aed7f8',kind: 1,timestamp: 1774511881199000,duration: 37289.78,attributes: {'http.url': 'http://localhost:3000/api/urls','http.host': 'localhost:3000','net.host.name': 'localhost','http.method': 'GET',[...]},status: { code: 0 },events: [],links: []}
You might notice the span attributes use deprecated naming conventions like
http.methodandhttp.url. The OpenTelemetry semantic conventions have since moved tohttp.request.methodandurl.full, and newer versions of the instrumentation libraries are migrating to the updated names. The distinction doesn't affect how tracing works, but it's worth knowing when you're querying or filtering spans in your backend.
Under the resource > attributes object, you should observe that service.name
is set to the configured OTEL_SERVICE_NAME. This attribute is carried on every
signal the service emits, and
it's the primary key
that observability backends use for filtering and grouping.
Without it, your telemetry lands under a generic name like
unknown_service:node, which makes it indistinguishable from any other service
that also forgot to set one. When something breaks at 2 AM, that's the last
situation you want to be in, so if you see the wrong name, double-check that the
variable is set correctly in docker-compose.yml before moving on.
The other attributes in the resource object (host.arch, process.pid,
process.runtime.version, and so on) were populated automatically by the SDK's
resource detectors. By default, the Node.js SDK uses all available detectors,
but you can control that through the OTEL_NODE_RESOURCE_DETECTORS environment
variable:
1OTEL_NODE_RESOURCE_DETECTORS="host,env,process,container"
For attributes that can't be detected automatically, you can set them explicitly
through OTEL_RESOURCE_ATTRIBUTES in your .env:
1OTEL_RESOURCE_ATTRIBUTES=deployment.environment.name=development,service.version=1.0.0
In production, the Collector is the best place for resource enrichment because it works consistently across all services regardless of language or runtime. The resource detection processor can automatically attach cloud provider and container metadata, while the Kubernetes attributes processor adds pod, namespace, deployment, and node information to every signal passing through the pipeline.
Setting up the OpenTelemetry Collector and Jaeger
You've now confirmed that spans are being created with the right service identity. But to actually explore traces visually, you need to send them to a tracing backend.
In this section, you'll set up an
OpenTelemetry Collector
and Jaeger, then
switch the exporter from console to
otlp so the SDK
starts forwarding spans through the Collector.
Create a Collector configuration file at your project root:
1234567891011121314151617181920# otelcol.yamlreceivers:otlp:protocols:http:endpoint: 0.0.0.0:4318exporters:otlp_grpc/jaeger:endpoint: jaeger:4317tls:insecure: truedebug:verbosity: basicservice:pipelines:traces:receivers: [otlp]exporters: [otlp_grpc/jaeger, debug]
The Collector listens for OTLP over HTTP on port 4318 (matching what the SDK
will send) and exports them to Jaeger over gRPC. The
debug exporter also
prints a summary to the Collector's stdout, which is useful for verifying that
spans are actually flowing through the Collector pipeline.
Now add the Collector and Jaeger services to your docker-compose.yml:
12345678910111213141516171819# docker-compose.ymlservices:# [...existing services]collector:image: otel/opentelemetry-collector-contrib:0.157.0volumes:- ./otelcol.yaml:/etc/otelcol-contrib/config.yamlports:- 4318:4318networks:- appjaeger:image: jaegertracing/jaeger:2.20.0ports:- 16686:16686- 4317:4317networks:- app
With this infrastructure in place, update your .env to switch from the console
exporter to OTLP and specify the correct endpoint through
OTEL_EXPORTER_OTLP_ENDPOINT:
12OTEL_TRACES_EXPORTER=otlpOTEL_EXPORTER_OTLP_ENDPOINT=http://collector:4318
Then reference the new endpoint variable in docker-compose.yml for both
services, and add a dependency on the Collector so the services don't start
before it's ready:
1234567891011121314151617181920services:shortener:# ... existing config ...environment:# ... existing vars ...OTEL_EXPORTER_OTLP_ENDPOINT: ${OTEL_EXPORTER_OTLP_ENDPOINT}depends_on:# ... existing deps ...collector:condition: service_startedredirector:# ... existing config ...environment:# ... existing vars ...OTEL_EXPORTER_OTLP_ENDPOINT: ${OTEL_EXPORTER_OTLP_ENDPOINT}depends_on:# ... existing deps ...collector:condition: service_started
Rebuild and bring up all the services now with:
1docker compose up -d --build
Once everything is running, shorten some URLs through the UI to generate some
traces and navigate to the shortened URLs. Then open the Jaeger UI at
http://localhost:16686, select the shortener service, and click Find
Traces.
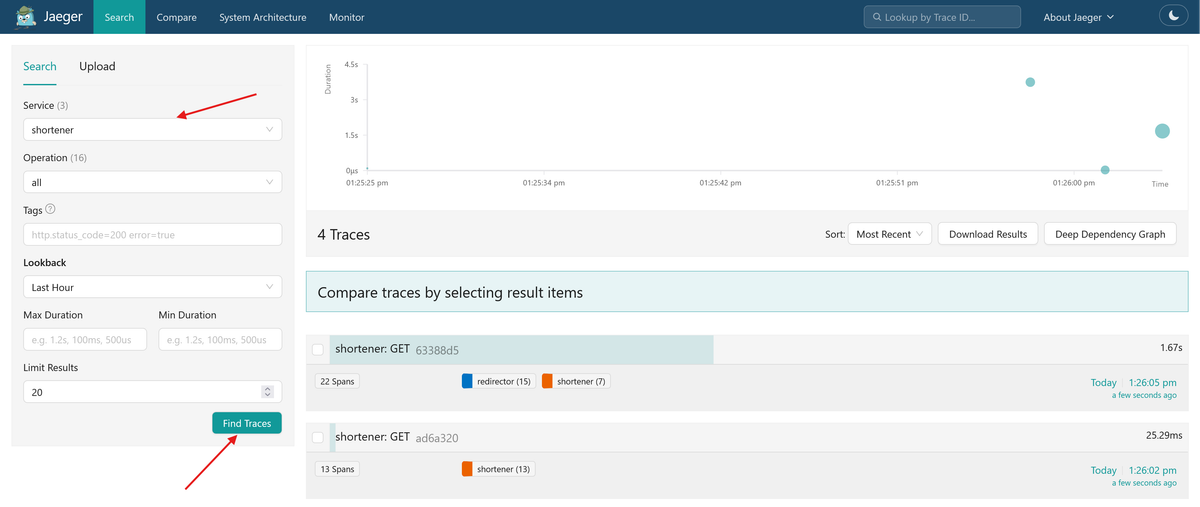
Click on the trace for the redirect request to see something like this:
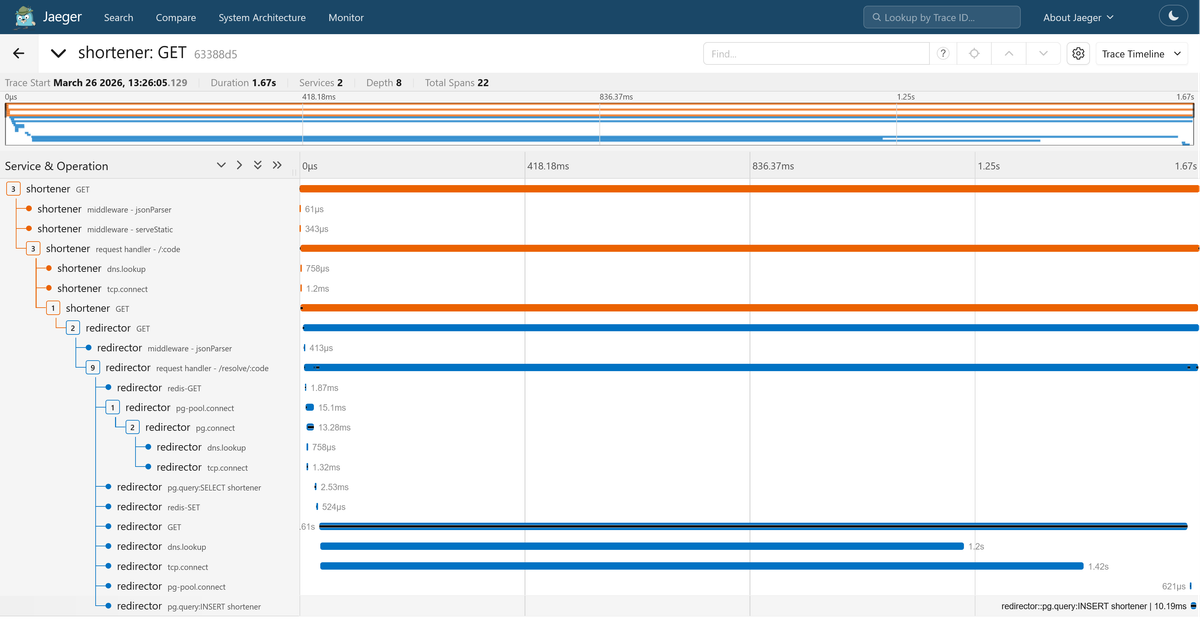
This is a distributed trace spanning 22 spans across both services. The root
span is the Shortener's GET request, with Express middleware spans
(jsonParser, serveStatic) and the request handler - /:code route nested
beneath it. You can also see dns.lookup and tcp.connect spans that the
auto-instrumentation captured at the network level.
The outbound HTTP call to the Redirector appears as a child GET span on the
Shortener, and beneath it the Redirector's own GET and request handler -
/resolve/:code spans begin.
Inside the Redirector's handler, you can see the full resolution sequence: a
redis-GET for the cache lookup, a pg.query:SELECT for the database fallback
(along with pg-pool.connect and pg.connect spans for the connection setup),
a redis-SET to re-populate the cache, then the outbound GET to ip-api.com
for geolocation (with its own dns.lookup and tcp.connect children), and
finally a pg.query:INSERT to record the visit.
All of this happened without writing a single line of tracing code. The auto-instrumentation libraries handled span creation, context propagation, and attribute population for every HTTP request, database query, and Redis command.
Customizing the auto-instrumentation
The default auto-instrumentation gives you broad coverage, but looking at the trace you just generated, two things stand out that are worth tuning.
Filtering out noisy spans
The trace includes spans for low-level operations like dns.lookup,
tcp.connect, and pg-pool.connect. These are created because the
auto-instrumentation bundle patches every library it recognizes by default,
including networking primitives that sit beneath the higher-level libraries you
actually care about. For most debugging workflows, these spans add clutter
without diagnostic value.
The OTEL_NODE_ENABLED_INSTRUMENTATIONS environment variable lets you whitelist
only the instrumentations you want. Add it to your .env:
1OTEL_NODE_ENABLED_INSTRUMENTATIONS=http,pg,redis,undici,pino
Then reference it in docker-compose.yml for both services:
1OTEL_NODE_ENABLED_INSTRUMENTATIONS: ${OTEL_NODE_ENABLED_INSTRUMENTATIONS}
You can find the full list of instrumentation names in the
auto-instrumentations-node README.
The names you pass to this variable match the suffix of each package name, so
@opentelemetry/instrumentation-pg becomes pg,
@opentelemetry/instrumentation-express becomes express, and so on.
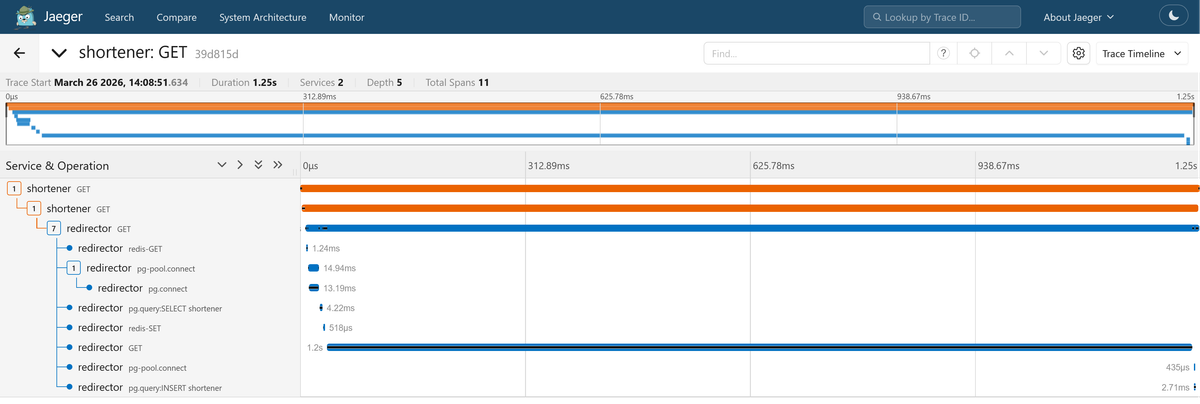
After restarting, the traces in Jaeger will be significantly cleaner, showing
only HTTP, PostgreSQL, Redis, and outbound fetch operations without the
low-level networking noise.
If you prefer to use a blocklist instead, use
OTEL_NODE_DISABLED_INSTRUMENTATIONS instead.
Customizing spans programmatically
Some customizations go beyond what environment variables can express. For
example, the spans produced by the http and undici instrumentations may have
generic names such as GET or POST without any indication of which endpoint
was called or which dependency was targeted. When the Shortener calls the
Redirector, or the Redirector calls ip-api.com, those spans all look identical
in Jaeger.
To fix this, you need programmatic access to the SDK configuration. You already
installed @opentelemetry/auto-instrumentations-node for the zero-code setup.
Now install the SDK and OTLP exporter packages needed for programmatic
configuration:
12npm install @opentelemetry/sdk-node \@opentelemetry/exporter-trace-otlp-proto
Then create a lib/otel.js file that initializes the SDK explicitly:
12345678910111213141516171819202122232425262728293031323334353637383940414243444546474849// lib/otel.jsimport { getNodeAutoInstrumentations } from "@opentelemetry/auto-instrumentations-node";import { OTLPTraceExporter } from "@opentelemetry/exporter-trace-otlp-proto";import { NodeSDK } from "@opentelemetry/sdk-node";const sdk = new NodeSDK({traceExporter: new OTLPTraceExporter(),instrumentations: [getNodeAutoInstrumentations({"@opentelemetry/instrumentation-undici": {requestHook(span, request) {const url = new URL(request.origin);span.updateName(`${request.method} ${url.host}`);},},"@opentelemetry/instrumentation-http": {applyCustomAttributesOnSpan(span, request) {const routePath = request.route?.path;if (!routePath) {return;}const route = `${request.baseUrl ?? ""}${routePath}`;span.updateName(`${request.method} ${route}`);},},"@opentelemetry/instrumentation-pg": {ignoreConnectSpans: true,},}),],});sdk.start();async function shutdown() {try {await sdk.shutdown();} catch (error) {console.error("Failed to shut down OpenTelemetry SDK", error);} finally {process.exit(0);}}process.once("SIGTERM", shutdown);process.once("SIGINT", shutdown);
Each instrumentation package in the getNodeAutoInstrumentations config is
referenced by its full npm package name (for example,
@opentelemetry/instrumentation-http), and the object you pass as its value
maps directly to the options that package accepts.
To find what's available for a given instrumentation, check the auto-instrumentations-node GitHub README, which lists every supported package along with a link to its README, which documents the full set of configuration options.
In this example, you're customizing the http, pg, and undici
instrumentations. The http hook renames inbound server spans from GET to
something like GET /resolve/:code, while the undici hook renames outbound
fetch() spans to include the target host (like GET redirector:3001 or
GET ip-api.com).
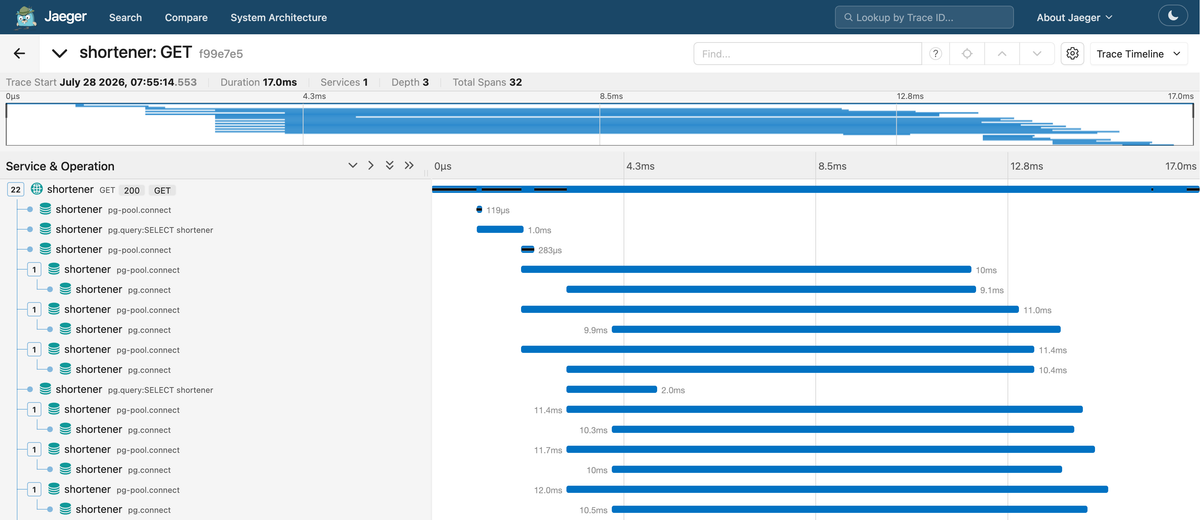
This is also a good place to disable the often-noisy pg-pool.connect and
pg.connect connection spans while retaining spans for database queries:
Depending on the specific instrumentation library, you can also attach custom attributes from request or response data, exclude selected endpoints, and capture specific request or response headers.
The signal handlers (SIGTERM and SIGINT) shut down the SDK before
terminating the process, allowing its span processors and exporter to flush
buffered telemetry. A production application should also stop accepting requests
and wait for in-flight operations before shutting down OpenTelemetry.
To see this in action, update your package.json scripts as follows:
123456{"scripts": {"shortener": "node --import ./lib/otel.js shortener/index.js","redirector": "node --import ./lib/otel.js redirector/index.js"}}
Then change the NODE_OPTIONS variable in your .env file to remove the
auto-instrumentation register while retaining the ESM loader:
12# .envNODE_OPTIONS=--experimental-loader=@opentelemetry/instrumentation/hook.mjs
The application already loads your custom OpenTelemetry SDK through its
--import ./lib/otel.js command-line option. Keeping
--import @opentelemetry/auto-instrumentations-node/register would initialize a
second, default SDK alongside your custom configuration, potentially causing
duplicate instrumentation and registration conflicts. The OTEL_* environment
variables stay unchanged since the programmatic setup reads them the same way
the zero-code setup did.
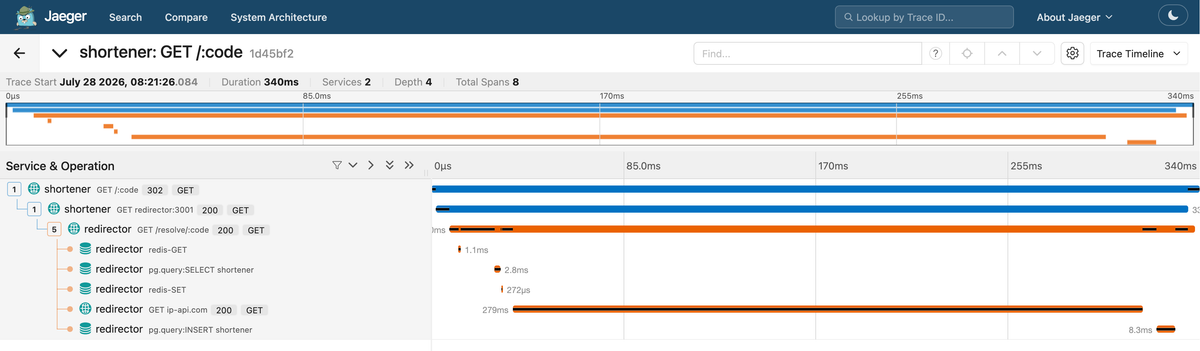
After restarting the services, both inbound and outbound HTTP spans in Jaeger
will carry more descriptive and recognizable names, and you won't see
pg.connect or pg-pool.connect spans anymore:
Tracing your business logic
Auto-instrumentation combined with the customizations from the previous section already gives you a substantial amount of visibility.
Without writing any tracing code in your application, you can see the full lifecycle of a request as it flows from the Shortener to the Redirector, identify which database queries and Redis commands are executed along the way, measure how long each operation takes relative to the overall request duration, and trace outbound calls to external dependencies like ip-api.com.
For many debugging scenarios, this level of detail is enough to pinpoint slow queries, failing dependencies, or unexpected call patterns.
Where auto-instrumentation falls short is inside your business logic. The metadata extraction in the Shortener, the HTML parsing, the visit recording: these are all invisible in the current traces because no library boundary exists for the auto-instrumentation to hook into.
Manual instrumentation fills that gap by letting you wrap specific operations in spans, attach attributes that capture what happened and why, and mark failed operations so they can be investigated alongside correlated application logs.
Instrumenting the metadata extraction function
The extractMetadata() function in shortener/metadata.js fetches a target
URL, checks the response, and parses the HTML to extract a title and
description.
Several things can go wrong along the way: the fetch might time out, the
response might not be HTML or it might lack a title tag entirely. The
automatically instrumented fetch() span may expose transport or HTTP failures,
but it cannot explain application-level outcomes such as an unusable content
type, missing metadata, or a parsing decision.
By instrumenting this function with additional spans, you'll be able to see how long metadata extraction takes as a distinct operation within the trace, capture useful outcomes through span attributes and mark failed extractions with an error status.
Here's the instrumented version of shortener/metadata.js:
12345678910111213141516171819202122232425262728293031323334353637383940414243444546474849505152535455// shortener/metadata.jsimport { SpanStatusCode, trace } from "@opentelemetry/api";import * as cheerio from "cheerio";import { logger } from "../lib/logger.js";const tracer = trace.getTracer("shortener.metadata");export async function extractMetadata(url) {return tracer.startActiveSpan("extract-metadata", async (span) => {try {const response = await fetch(url, {headers: {"User-Agent": "Shortener/1.0",},signal: AbortSignal.timeout(5000),});const contentType = response.headers.get("content-type") || "";if (!response.ok || !contentType.includes("text/html")) {throw new Error(`Unusable response: ${response.status} ${contentType}`);}const html = await response.text();span.setAttribute("metadata.html_bytes", html.length);const $ = cheerio.load(html);const title =$('meta[property="og:title"]').attr("content") ||$("title").first().text().trim() ||null;const description =$('meta[property="og:description"]').attr("content") ||$('meta[name="description"]').attr("content") ||null;span.setAttribute("metadata.has_title", title !== null);span.setAttribute("metadata.has_description", description !== null);return { title, description };} catch (err) {span.setStatus({code: SpanStatusCode.ERROR,message: err instanceof Error ? err.message : String(err),});logger.error({ err }, "Failed to extract metadata");return { title: null, description: null };} finally {span.end();}});}
The trace.getTracer() call is how you obtain a tracer for creating manual
spans and you must pass a string (shortener.metadata) to specify the
instrumentation scope name.
While OTEL_SERVICE_NAME identifies which service produced the telemetry
(like shortener or redirector), the scope name identifies which component
within that service produced it.
In your telemetry backend, you'll see spans scoped to shortener.metadata (your
code) alongside spans scoped to @opentelemetry/instrumentation-pg or
@opentelemetry/instrumentation-undici (the auto-instrumentation libraries),
all within the same shortener service.
This tracer comes from the same TracerProvider that the SDK initialized in
otel.js, so manual spans you create with it are automatically part of the same
traces that auto-instrumentation initiates.
If you create a span inside an Express request handler, it becomes a child of the auto-instrumented HTTP span for that request because both share the same active context. This is what makes the two approaches composable: auto-instrumentation provides the scaffolding, and manual spans fill in the details.
When you call tracer.startActiveSpan(), the new span becomes the active span
on the current context. Any spans created inside the callback, including the
auto-instrumented span from the fetch call, automatically become children of
this span. This is how the trace tree grows without you manually wiring
parent-child relationships.
The catch block logs the error and calls span.setStatus() (which tracing
backends often highlight in the UI). The exception itself is written through the
application logger, which preserves details such as the stack trace. When logs
are correlated with the active OpenTelemetry context, the resulting log record
carries the trace and span identifiers needed to navigate between the error and
the corresponding span.
If you skip either one, failed operations either appear as successful spans or
you'll lack the detail needed to diagnose the failure. The finally block
guarantees that span.end() is called exactly once regardless of which code
path executes, ensuring the span is always exported.
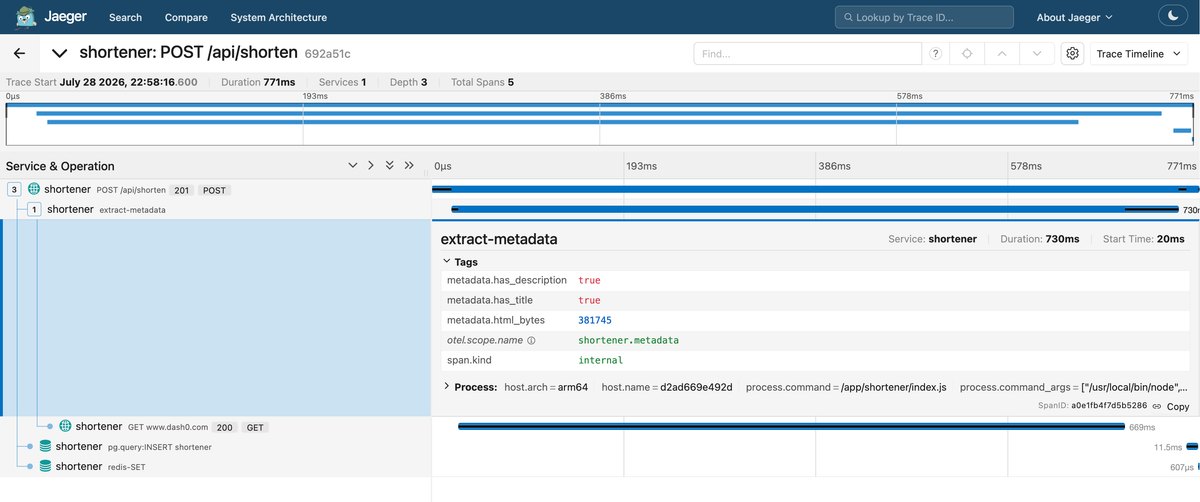
After rebuilding the services and shortening a URL, open the trace for the
POST /api/shorten request in Jaeger. You should see the extract-metadata
span nested under the HTTP server span, with the auto-instrumented outbound
fetch span as its child. Expand the span's Tags to see the
metadata.has_title, metadata.has_description, and metadata.html_bytes
attributes:
Enriching existing auto-instrumented spans
The manual span you added to extractMetadata() captures an operation that was
previously invisible. But the auto-instrumented spans already in your traces can
also carry business context beyond what the instrumentation libraries record by
default.
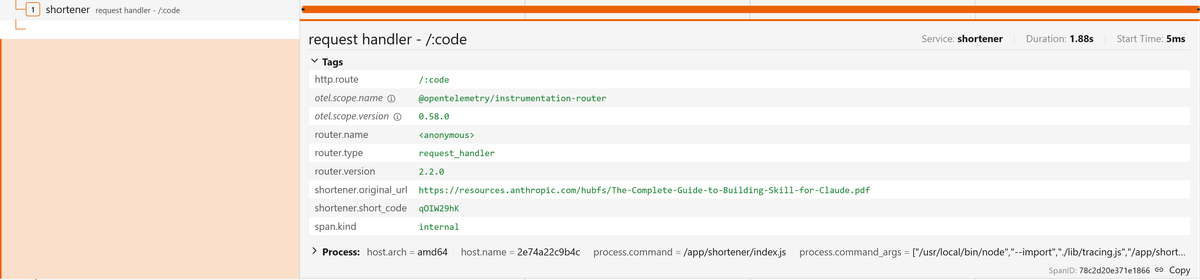
The HTTP server span for each request already tracks timing and status; attaching your own attributes to it makes that span searchable and filterable by dimensions that matter to your application.
For example, in the redirect proxy (GET /:code), you can record which short
code was requested and where it resolved to:
123456789101112131415161718192021222324252627// shortener/routes.jsimport { trace } from "@opentelemetry/api";// [...]router.get("/:code", async (req, res) => {const { code } = req.params;try {// [...]const span = trace.getActiveSpan();if (span) {span.setAttribute("shortener.short_code", code);const sanitizedUrl = new URL(body.original_url);// Remove query parameters to reduce the risk of capturing sensitive values.// Production code may need a broader redaction policysanitizedUrl.search = "";span.setAttribute("shortener.original_url", sanitizedUrl.href);}res.redirect(302, body.original_url);} catch (err) {console.error("Redirect proxy failed:", err);res.status(502).json({ error: "Redirector service unavailable" });}});
And in the Redirector's resolve/:code handler:
123456789101112131415161718192021222324// redirector/routes.jsimport { trace } from "@opentelemetry/api";// [...]router.get("/resolve/:code", async (req, res) => {const { code } = req.params;try {// Step 1: Check Redis cacheconst cached = await redis.get(`urls:${code}`);const span = trace.getActiveSpan();if (span) {span.setAttribute("shortener.short_code", code);span.setAttribute("shortener.cache_hit", !!cached);}// [...]} catch (err) {console.error("Resolve failed:", err);res.status(500).json({ error: "Internal server error" });}});
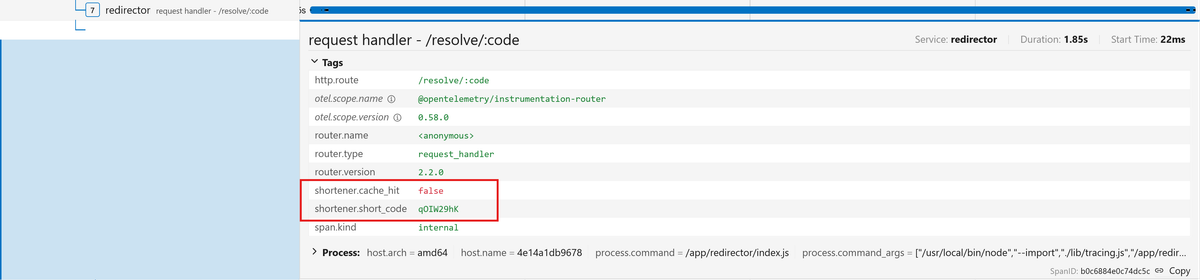
The shortener.cache_hit attribute is valuable because it tells you immediately
whether a redirect served from Redis or fell back to PostgreSQL, which is the
most common performance-relevant distinction in this application. You'll see
this attribute pay off in the debugging section later.
The if (span) guard is a defensive pattern worth adopting since
getActiveSpan() returns undefined if there's no active span in the current
context (which can happen if the SDK isn't initialized), so the guard prevents
your application code from crashing when tracing is absent.
Also notice that you don't call span.end() here. The auto-instrumentation owns
this span and will end it when the request completes. Calling span.end()
yourself would close the span prematurely before the handler finishes.
Using traces to debug your services
The instrumentation you've built so far gives you visibility into the structure and timing of every request. Now it's time to put that visibility to work.
The demo application has two subtle bugs baked in that are invisible from the outside: the app works correctly with no errors and no crashes, but it's doing more work than it needs to. Tracing is how you'll find out.
Finding the N+1 query
Open http://localhost:3000 in your browser to load the Snip UI. It should load
normally and show all your shortened URLs.
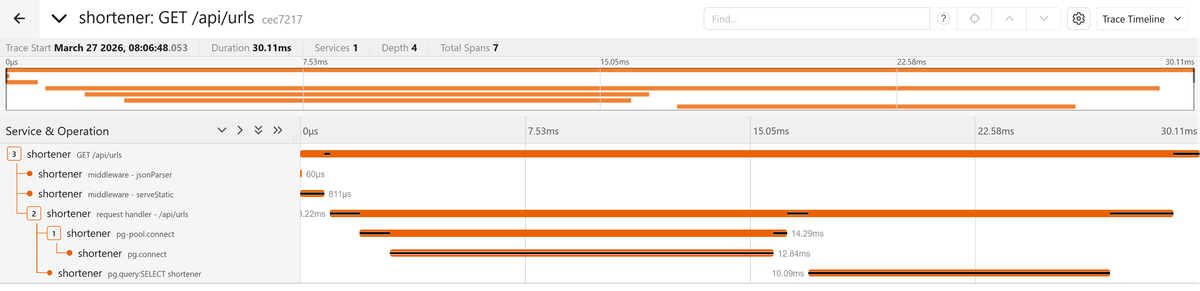
Now open Jaeger, find the trace for the GET /api/urls request, and look at the
span timeline:
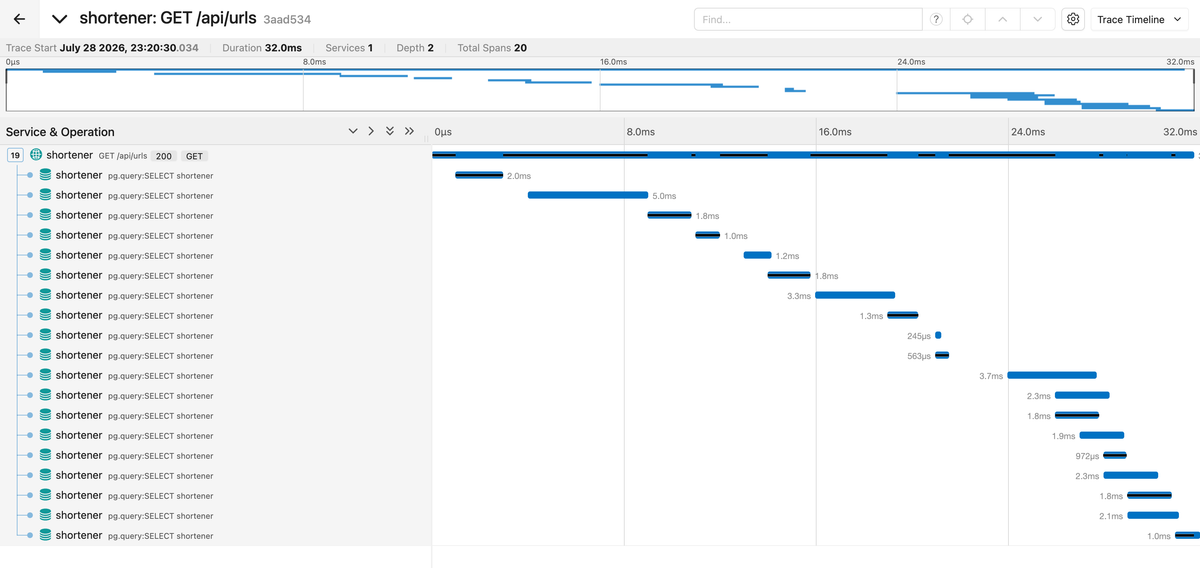
You should see something striking: several spans for what should be a simple
list query. The trace begins with the Express middleware and route handler
spans, then expands into repeated pg.query:SELECT operations.
Each URL in the list triggers a separate connection acquisition and count query. Some of these operations overlap in the timeline because the application starts them concurrently, but they still create unnecessary database work and compete for a limited number of pooled connections.
12345678910111213141516171819// shortener/routes.jsrouter.get("/api/urls", async (_req, res) => {const result = await db.query("SELECT short_code, original_url, title, description, created_at FROM urls ORDER BY created_at DESC LIMIT 20",);// Fetch visit count for each URL individuallyconst rows = await Promise.all(result.rows.map(async (row) => {const visits = await db.query("SELECT COUNT(*) FROM visits WHERE short_code = $1",[row.short_code],);return { ...row, visit_count: parseInt(visits.rows[0].count, 10) };}),);res.json(rows);});
In your PostgreSQL logs, you'll see successful database queries and nothing looks wrong. Each query completes quickly on its own, but the trace reveals an N+1 query pattern: after fetching the initial list of URLs, the application issues an additional count query for every row.
Because the code uses Promise.all(), these queries are started concurrently
rather than strictly one after another. Their actual execution is still limited
by the PostgreSQL connection pool and the database's ability to process them.
When the number of rows exceeds the available connections, some queries must
wait for a connection while others execute.
Even when the queries overlap, the pattern creates unnecessary database work, increases connection-pool pressure, and makes request latency more sensitive to the number of returned rows. The repeated database spans in the trace make this query amplification immediately visible.
Instead of issuing one count query per URL, calculate the counts as part of the original query using a join and aggregation. This reduces the operation from one initial query plus one query per result to a single database request:
12345678910111213141516router.get("/api/urls", async (_req, res) => {const result = await db.query(`SELECT u.short_code, u.original_url,u.title, u.description,u.created_at,COUNT(v.id)::int AS visit_countFROM urls uLEFT JOIN visits vON u.short_code = v.short_codeGROUP BY u.idORDER BY u.created_at DESCLIMIT 20`,);res.json(result.rows);});
After applying the fix and restarting, the same request produces a trace with a single PostgreSQL span, and the total duration drops accordingly.
Finding the phantom cache miss
The N+1 query was visible because it produced an obvious waterfall of spans, but some performance problems are subtler. They don't create extra spans or slow things down dramatically; they just quietly do more work than necessary on every request. The custom attributes you added to the auto-instrumented spans are what make these problems discoverable.
Create a short URL, then follow the redirect. Go to Jaeger and open the trace
for the redirect request. Then look at the shortener.cache_hit attribute on
the Redirector's request handler - /resolve/:code span:
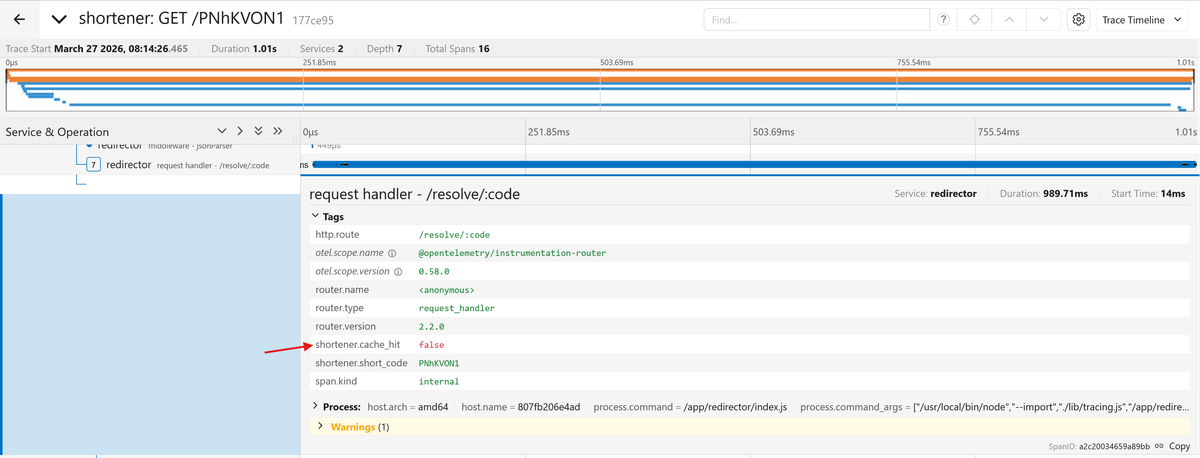
It should be true since you just created this URL and the Shortener cached it
in Redis. But the attribute reads false. Redirect the same URL again and it
now reads true:
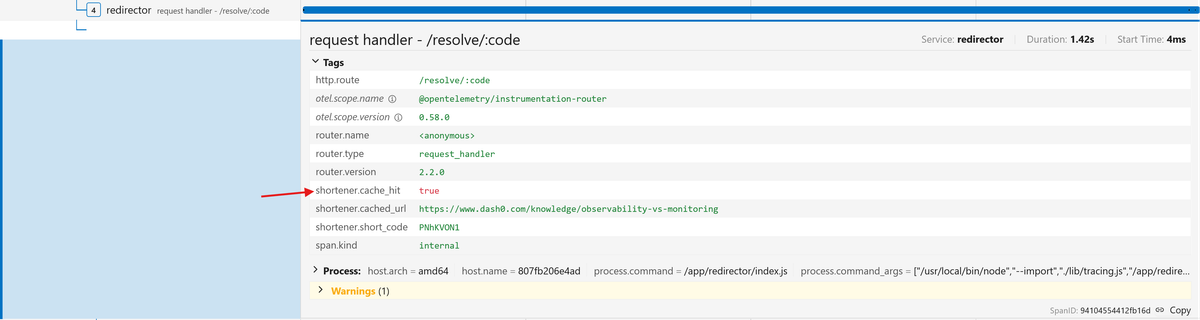
So the cache works on subsequent requests (as long as the entry hasn't expired), but the very first redirect after creation always misses, even though the Shortener wrote the cache entry moments earlier. Something is wrong between the write and the first read.
Check the Redis cache key that the Shortener writes on URL creation:
12// shortener/routes.jsawait redis.set(`url:${shortCode}`, url, { EX: 86400 });
Now check what the Redirector reads:
12// redirector/routes.jsconst cached = await redis.get(`urls:${code}`);
You should immediately spot that the problem is url: vs urls:. On the first
redirect, the Redirector reads from a key that was never written, falls back to
PostgreSQL, then writes its own cache entry under the urls: prefix.
Subsequent redirects hit that entry and appear to work fine, which is exactly why this bug is so easy to miss. The app functions correctly from the user's perspective, but every first redirect after creation pays the database cost unnecessarily, and Redis accumulates a parallel set of entries under the wrong prefix.
Fix the Redirector to use the correct key format:
1234// redirector/routes.jsconst cached = await redis.get(`url:${code}`);// ...await redis.set(`url:${code}`, originalUrl, { EX: 86400 });
After rebuilding the services, create a new short URL and visit it immediately.
The first visit should show shortener.cache_hit: true in the trace, and the
PostgreSQL SELECT query span disappears.
Detailed logs could reveal either problem, but only if the application already records the relevant database queries and cache decisions with enough request context to correlate them.
The trace exposes the structure automatically since repeated database spans reveal the N+1 pattern, while the cache attribute explains the unexpected miss in the context of the request that triggered it.
Correlating Node.js logs with traces
Traces show how a request moved through the system, but they don't necessarily contain every detail you need during an investigation. Application logs may include validation failures, retry decisions, intermediate values, or other diagnostic context that may be inappropriate to attach to every span.
By including trace and span identifiers in log records, you can correlate a log entry with the exact operation that produced it.
In this demo, the
OpenTelemetry Pino instrumentation
is enabled automatically as part of the Node.js auto-instrumentation setup. When
Pino writes a log while a span is active, the instrumentation adds the current
trace_id, span_id, and trace_flags fields to the JSON log record.
You can see this in the application’s container logs when you deliberately cause
the extractMetadata() function to fail by attempting to shorten a nonexistent
URL.
The error log produced from the catch block of that function will look similar
to this:
123456789101112131415{"level": 50,"time": 1785277229997,"pid": 19,"hostname": "c80b31a3ec16","trace_id": "658f9b84fcb8f0bec442a6ba4b2432e7","span_id": "0402d3160faa3c81","trace_flags": "01","err": {"type": "Error","message": "Unusable response: 404 text/html","stack": "Error: Unusable response: 404 text/html\n at file:///app/shortener/metadata.js:20:11\n at process.processTicksAndRejections (node:internal/process/task_queues:104:5)\n at async file:///app/shortener/routes.js:47:20"},"msg": "Failed to extract metadata"}
The trace_id identifies the complete distributed trace, while the span_id
identifies the specific operation that was active when the log was written.
OpenTelemetry trace and span identifiers use standardized hexadecimal
representations, allowing observability backends to use them as correlation
keys.
So if you're investigating an error in Jaeger and need more details, you can copy the trace ID and search the container logs for every message emitted during that request:
12docker compose logs shortener redirector |grep 658f9b84fcb8f0bec442a6ba4b2432e7
Searching by trace_id returns logs from the entire request, potentially across
multiple services. Searching by span_id narrows the results to messages
produced during a particular operation.
This gives you two complementary views of the same incident:
- The trace shows the request path, operation timings, dependencies, and errors.
- The logs provide detailed messages recorded while those operations were running.
This is useful, but since Jaeger stores traces only, it cannot ingest these application logs or provide direct navigation between a span and its corresponding log records.
A backend that supports both signals can use the embedded identifiers to connect them automatically, so let's set that up next.
Sending traces and logs to a production backend
Jaeger is a great tool for exploring traces in development, but production investigations often span logs, metrics, and traces.
You might need to determine which deployment introduced a latency regression, how a slow trace relates to a spike in error logs, or what resource metrics looked like for the pod that handled a request.
Answering these questions requires a backend that treats all telemetry signals as connected parts of the same system rather than isolated data streams.
Dash0 is an OpenTelemetry-native observability platform, meaning its storage, query engine, and UI are designed around the OTel data model from the ground up rather than translating OTel data into a proprietary format on the way in.
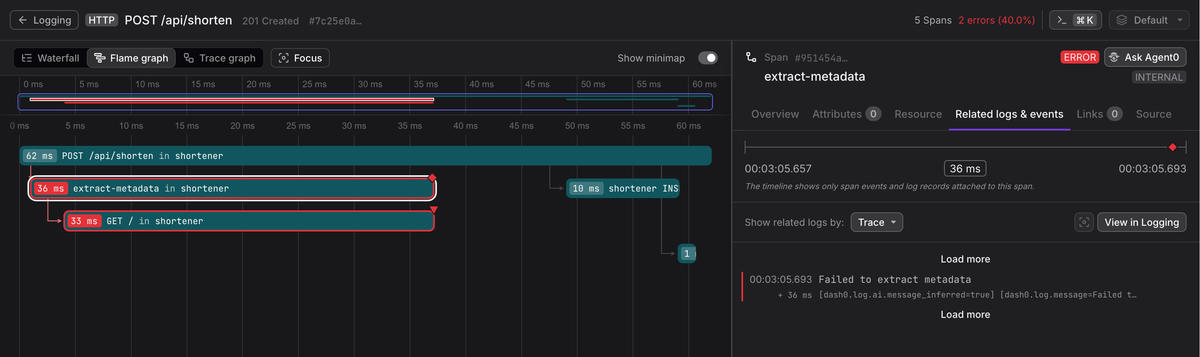
Since your application already exports OpenTelemetry traces through the Collector, sending data to Dash0 is simply a configuration change. And since the Pino instrumentation has already added trace and span identifiers to the application logs, the remaining steps are to enable OTLP log export and add a logs pipeline to the Collector.
Update your otelcol.yaml to add Dash0 as an exporter for the traces and
logs pipelines:
123456789101112131415exporters:otlp_grpc/dash0:endpoint: ingress.eu-west-1.aws.dash0.com:4317headers:Authorization: Bearer <DASH_AUTH_TOKEN>Dash0-dataset: <DASH0_DATASET>service:pipelines:traces:receivers: [otlp]exporters: [otlp_grpc/dash0]logs:receivers: [otlp]exporters: [otlp_grpc/dash0, debug]
Finally, change the OTEL_LOGS_EXPORTER value in your .env from none to
otlp:
12# .envOTEL_LOGS_EXPORTER=otlp
Setting OTEL_LOGS_EXPORTER=otlp causes the Node SDK to export log records
captured by supported logging instrumentations over OTLP. They use the same
OTEL_EXPORTER_OTLP_ENDPOINT already configured for traces, so no separate
application endpoint is required.
You can rebuild your services now and see your traces and correlated logs in Dash0 once you generate additional telemetry by shortening a few URLs:
Final thoughts
You started with a working application and added visibility across service boundaries, database queries, cache operations, outbound requests, and business logic.
Auto-instrumentation provided the baseline, while programmatic configuration and manual spans made the traces more useful. You then used that telemetry to uncover an N+1 query pattern and a cache-key mismatch that would have been harder to recognize from typical application logs alone.
You also connected logs and traces through the trace_id and span_id fields
added by the Pino instrumentation. Exporting both signals over OTLP allows a
backend such as Dash0 to present them as parts of the same investigation.
The goal is not to trace every function or attach every available value. Good instrumentation captures meaningful operations and outcomes while avoiding sensitive data and noisy spans.
This guide exports every trace, which is suitable for local development. A production setup should also consider sampling, redaction, resource enrichment, Collector reliability, retention, and access control.
