Last updated: June 11, 2026
OpenTelemetry Collector Contrib: A Beginner's Guide
If you've tried to run a config referencing filelogreceiver or
spanmetricsconnector and hit an error like unknown type: "filelog", you've
already encountered the core question this article addresses: there isn't one
OpenTelemetry Collector, there are several, and the one most people reach for
isn't the one
the official quickstart uses.
Most teams land on otelcol-contrib without much thought. It supports
Prometheus, Kafka, Kubernetes, cloud provider metrics, and just about everything
else, so it wins by default.
That's usually the right call, but it's worth understanding what you're actually getting: what contrib is, how it differs from the four other official distributions, what the maturity model means in practice, and when you should consider something else entirely.
What is an OpenTelemetry Collector distribution?
The OpenTelemetry Collector is a vendor-neutral binary that sits between your instrumented services and your observability backend. It receives telemetry (traces, metrics, logs) over one or more protocols, optionally transforms or filters it, and exports it to wherever you want the data to go. The pipeline model is straightforward: receivers ingest data, processors transform it, and exporters ship it out.
The Collector itself is built as a framework. At compile time, you can decide which receivers, processors, exporters, and extensions to include. The resulting binary is what's called a distribution: a specific, opinionated packaging of the Collector framework with a particular set of components baked in.
This matters because not every component lives in the same place. The OTel project separates components by who maintains them and how stable they are. Some live in the core repository and are maintained directly by the OTel project. Others live in the contrib repository and are maintained by vendors, individual contributors, or the wider community. A distribution decides which of those components to bundle.
The distribution you choose determines what your collector binary can and can't do, how large it is, how auditable the dependency tree is, and how much community support you can expect when something goes wrong with a specific component.
Most teams never think explicitly about this choice because the default answer, otelcol-contrib, covers almost every use case. But understanding what a distribution actually is makes the trade-offs between the available options much clearer.
Understanding the five official distributions
The opentelemetry-collector-releases repository currently assembles and publishes five official distributions:
-
otelcolis a curated general-purpose distribution that includes a hand-picked set of contrib components alongside the core module: Prometheus, Kafka, Jaeger, Zipkin, host metrics, and a handful of common processors. It covers most standard use cases without pulling in the full contrib catalogue. -
otelcol-contribbundles every community-contributed component available: cloud provider receivers, the full range of vendor exporters, advanced processors like tail-based sampling and OTTL transformation, and much more. For most teams, this is the right starting point. -
otelcol-k8sis designed for monitoring Kubernetes and the services running in it. It includes the full Kubernetes receiver suite, host metrics, Prometheus, Jaeger, the complete contrib processor set, and a connector suite. It draws a hard line on exporters: OTLP only, with debug and file allowed for troubleshooting. -
otelcol-otlpis the stripped-down option for pure OTLP pipelines: OTLP receiver and OTLP exporters, nothing else. -
otelcol-ebpf-profilerruns as a node agent to collect continuous profiling data from all processes on the host via eBPF. It's built around theebpf-profilerreceiver, which is outside the core and contrib repositories entirely. Only reach for this if continuous profiling is specifically what you're setting up.
Beyond the official distributions, several vendors publish their own which typically bundle proprietary exporters or custom processors alongside the standard contrib components.
What contrib actually includes
The contrib repo has well over 200 components. The full list is in the manifest file on GitHub. Rather than walking through all of them, here's a practical survey of the categories you're most likely to care about.
Receivers
Contrib covers most ingest scenarios you're likely to encounter. For
infrastructure,
hostmetricsreceiver
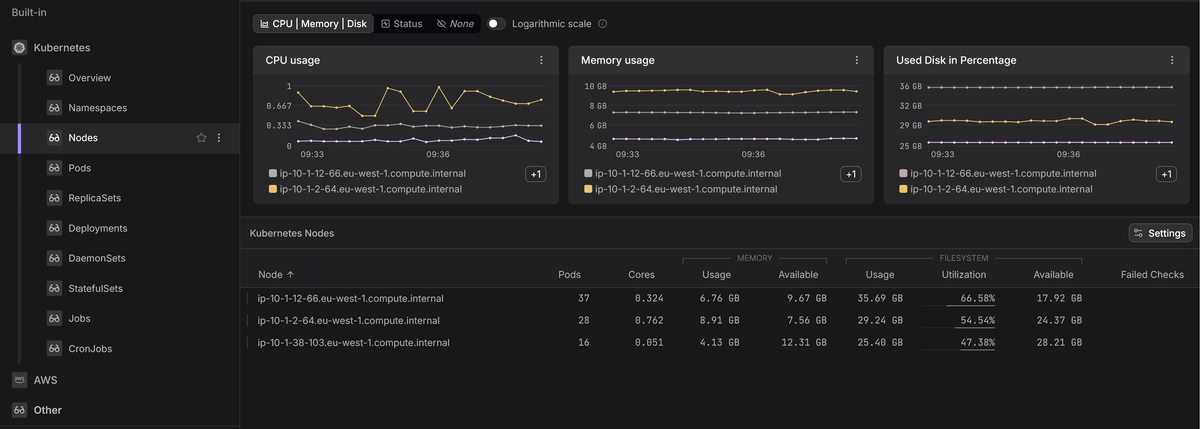
collects CPU, memory, disk, and network from the host, while
k8sclusterreceiver and kubeletstatsreceiver cover Kubernetes cluster and
pod-level metrics.
For logs,
filelogreceiver
tails files on disk,
journaldreceiver
reads from systemd, and windowseventlogreceiver handles Windows Event Log.
The
prometheusreceiver
scrapes any /metrics endpoint using standard Prometheus syntax. Beyond these,
there are receivers for cloud provider APIs (AWS CloudWatch, GCP, Azure), legacy
formats (Jaeger,
Zipkin), and a long tail
of databases, message queues, and application platforms.
Processors
A few Collector processors come up in almost every production deployment.
resourcedetectionprocessor
reads metadata from the runtime environment (hostname, cloud region, container
labels, Kubernetes pod attributes) and attaches it as resource attributes.
k8sattributesprocessor
does something similar but against the Kubernetes API: it enriches spans,
metrics, and logs with pod name, namespace, and deployment name by matching the
source IP. That's what lets you filter traces by Kubernetes labels in your
observability backend.
filterprocessor
drops or passes data based on conditions you define, which is useful for keeping
high-cardinality or low-value telemetry out of the pipeline entirely.
transformprocessor
uses OTTL to rewrite attributes, rename metrics, convert types, and scrub
sensitive values. It's the most flexible processor in contrib, and worth
learning properly if you're doing any significant pipeline work.
tailsamplingprocessor buffers complete traces in memory and applies sampling
policies after the fact. The typical use case is keeping 100% of error traces
while sampling healthy ones down, which cuts ingest volume without losing the
signal you actually care about.
Exporters
Many commercial observability backends have a dedicated exporter in contrib
distribution, but in practice the
otlpexporter and
otlphttpexporter
cover the majority of cases. Any backend that accepts OTLP doesn't need a
dedicated exporter.
Beyond those, contrib adds prometheusexporter and
prometheusremotewriteexporter for bridging to existing Prometheus
infrastructure, the
debugexporter for
pipeline development, and vendor-specific exporters for backends that don't yet
speak OTLP.
Extensions
Extensions sit outside the pipeline and add operational capabilities.
healthcheckextension exposes an HTTP endpoint for Kubernetes liveness and
readiness probes. zpagesextension provides a local debug UI showing pipeline
health and per-component error counts. pprofextension enables Go profiling,
which is useful when diagnosing memory or CPU issues in a collector under load.
Connectors
Connectors are a less visible but powerful feature that lets you link pipelines
together, using the output of one as the input to another.
spanmetricsconnector generates RED metrics (request rate, errors, duration)
directly from trace spans, so you get service-level metrics without separate
instrumentation.
servicegraphconnector builds a dependency graph from traces,
routingconnector fans out telemetry to different pipelines based on attribute
conditions, and countconnector generates metric counts from any signal type.
For most teams these are advanced territory, but spanmetricsconnector in
particular is worth knowing about if you want latency percentiles and error
rates without adding metrics instrumentation to every service.
How contrib components are governed
Contrib components aren't all equally maintained, and stability labels apply per signal, not per component.
A receiver might be stable for traces and metrics but only alpha for logs,
or development for profiles. That means you need to check the label for the
specific signal you're relying on, not just the component in general.
The four labels are:
-
developmentmeans the component (or signal support) is experimental. Its configuration schema can change without notice between releases, and it may be removed entirely. Don't use these in production. -
alphameans it works but should be expected to change. Schema changes are possible with some warning. Acceptable for internal tooling where you can absorb the maintenance cost. -
betameans the component is functionally complete and unlikely to have breaking schema changes, but isn't yet declared stable. This is where a lot of widely-used components live. Most teams use beta components in production without issues, but it's worth checking the changelog when upgrading. -
stablemeans there's a stability guarantee. Breaking changes require a deprecation cycle.
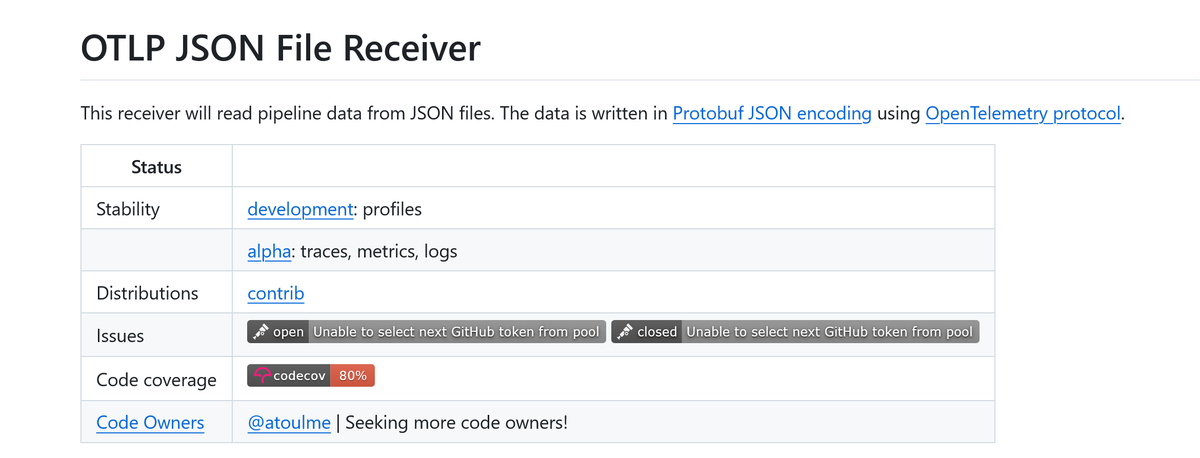
You can check stability for any component in its README.md inside the
contrib repository.
The "Status" table at the top lists stability per signal, which distributions
include the component, whether it has an active code owner, and any open issues
worth knowing about.
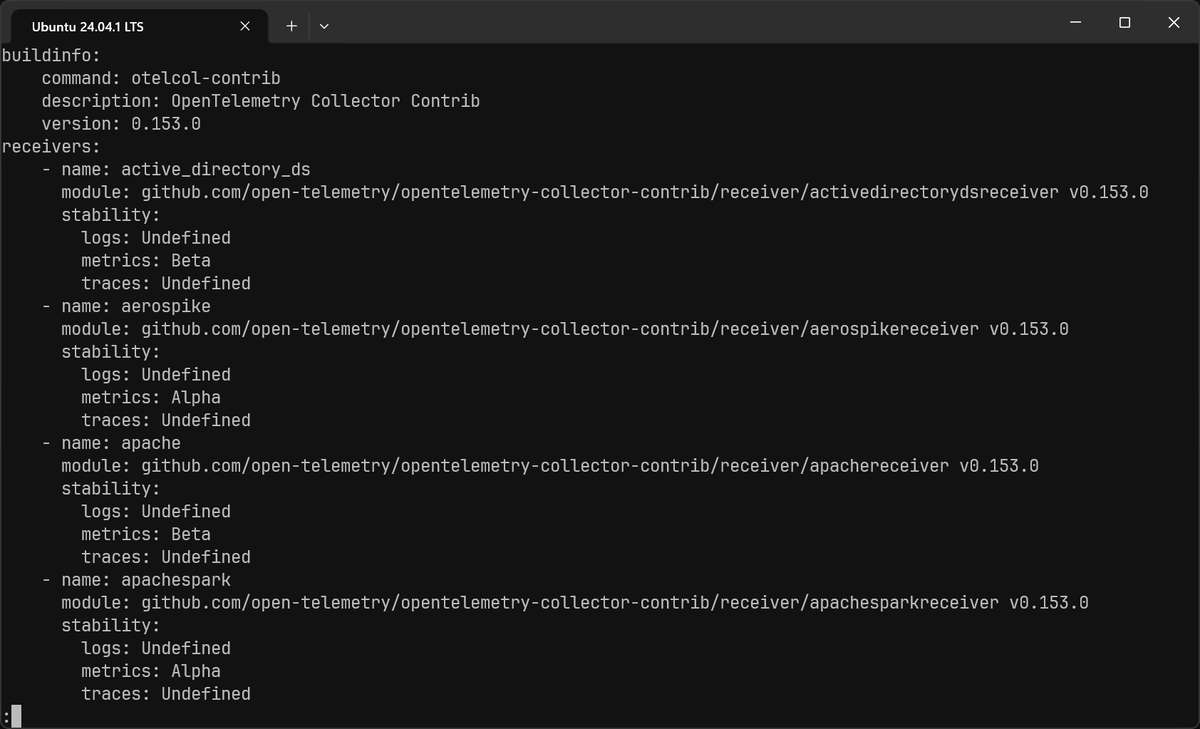
You can also run the command below to list every component bundled in your binary alongside its stability label per signal:
1otelcol-contrib components
Some alpha-stage behaviors are disabled by default even when the component itself is included in your binary. These are controlled by feature gates, a separate mechanism that guards specific functionality until it's ready for wider use. If you configure a component and it silently does nothing, a disabled feature gate is one of the first things to check.
You enable or disable gates with the --feature-gates flag at startup. Gate
identifiers are comma-separated; prefix with - to disable, + or no prefix to
enable:
123otelcol-contrib \--config=config.yaml \--feature-gates=receiver.prometheusreceiver.EnableNativeHistograms
To see every gate registered in your binary and its current state, run:
1otelcol-contrib --help | grep 'feature-gates'
Or check the component's README.md in the contrib repo, which lists any gates
it relies on alongside the stability table. The gate's own stage
(alpha/beta/stable) follows the same lifecycle as component stability: alpha
gates are off by default, beta gates are on by default, and stable gates have
been removed entirely because the behavior is now unconditional.
Choosing the right distribution
The OTel project's own guidance is worth stating plainly: the contrib distribution is a good starting point for trying out configurations, but for production it recommends limiting the collector to only the components you actually need. That means one of three paths: a more focused official distribution, a vendor distribution, or a custom build.
Unused components don't hurt runtime performance: anything not referenced in a pipeline processes no data and consumes no CPU or memory while the collector is running. The cost shows up elsewhere, in a larger binary with slower image pulls, longer startup times, and a wider CVE surface to track.
A practical decision tree looks like this:
otelcol-contrib is the right starting point and fine for the exploration phase
of a project, when you're still figuring out which components you need. It's
also reasonable for production if your team has checked the stability labels,
accepted the broader dependency surface, and doesn't have strict supply chain
requirements. Many teams run it in production without issues. Just don't end up
there by accident.
If you're running exclusively in Kubernetes, check the
otelcol-k8s manifest
before defaulting to contrib. If everything you need is there and you're not
sending to a vendor-specific backend, it's a better fit: you get tail-based
sampling, OTTL transformation, and the full Kubernetes receiver suite, without
the cloud provider receivers and database components that inflate the contrib
binary.
Once your pipeline design has stabilized and you know exactly which components you're using, a custom OCB build is the recommended path for production. Smaller binary, auditable dependency tree, no components you don't need.
Getting started with OpenTelemetry Collector Contrib
The fastest way to get otelcol-contrib running is with Docker. Assuming you
have the following configuration that accepts trace data over OTLP and exports
to Dash0:
1234567891011121314151617181920# otelcol.yamlreceivers:otlp:protocols:grpc:endpoint: 0.0.0.0:4317exporters:otlp_grpc/dash0:endpoint: ingress.eu-west-1.aws.dash0.com:4317headers:Authorization: "Bearer ${env:DASH0_AUTH_TOKEN}"debug:verbosity: detailedservice:pipelines:traces:receivers: [otlp]exporters: [debug, otlp_grpc/dash0]
Always include the
debugexporter in your
pipelines, at least while getting set up. It prints telemetry to stdout so you
can confirm the collector is actually receiving and processing data before
troubleshooting the wrong thing. You can remove it once the pipeline is working
as expected.
You can generate a Dash0 auth token from the Auth Tokens page in your organization settings. Create one with the appropriate ingestion permissions and set it as an environment variable before running the collector.
Then run:
123456docker run \-v ./otelcol.yaml:/etc/otelcol-contrib/config.yaml \-p 4317:4317 \-p 13133:13133 \-e DASH0_AUTH_TOKEN=your-token \otel/opentelemetry-collector-contrib:0.154.0
Note the config path: the contrib image expects its config at
/etc/otelcol-contrib/config.yaml, which differs from the core image
(/etc/otelcol/config.yaml). Mounting to the wrong path is a common first-run
failure.
To verify it's healthy, execute:
1curl http://localhost:13133/
You should see the following response:
12345{"status": "Server available","upSince": "2026-06-10T08:00:15.109447338+01:00","uptime": "25h41m14.845653814s"}
If that endpoint isn't responding, check docker logs first as a bad config
causes the process to exit immediately with no other indication.
For Docker Compose, a minimal setup looks like this:
123456789101112services:otelcol:image: otel/opentelemetry-collector-contrib:0.154.0command: ["--config=/etc/otelcol-contrib/config.yaml"]volumes:- ./otelcol.yaml:/etc/otelcol-contrib/config.yamlports:- "4317:4317"- "13133:13133"environment:- DASH0_AUTH_TOKEN=${DASH0_AUTH_TOKEN}restart: unless-stopped
Make sure you pin the image tag rather than using latest. The collector
releases every two weeks, and latest moves fast enough to cause unexpected
breakage.
For Kubernetes deployments, the OpenTelemetry Helm chart is the standard starting point. The official docs cover DaemonSet and Deployment modes in detail.
If you want something higher-level that manages the collector lifecycle and auto-instruments your workloads, the OpenTelemetry Operator is worth a look.
Release cadence and upgrade concerns
The OTel Collector releases on a roughly two-week cycle, tracking minor version bumps (0.150.0, 0.151.0, and so on), with contrib releasing in lockstep. That's fast enough that version drift is one of the most common operational problems teams run into: many deployments end up running distributions that are months behind, which means missed bug fixes, unpatched CVEs, and an increasingly painful upgrade when you eventually get to it.
The OTel project has acknowledged this. A stability proposal from late 2025 proposed a Release SIG to produce longer-lived "epoch releases" specifically for teams who can't validate and roll out changes at the project's shipping cadence.
In the meantime, a few things help: use
Renovate or Dependabot to track new
image tags and open PRs automatically so you know what you're skipping; scan the
"Breaking changes" section of the changelog before every upgrade; and pin
explicit versions everywhere rather than using latest. Deprecation warnings in
collector logs are worth treating as work items, and they're usually the only
signal you'll get before a config key stops working.
For custom builds via OCB, the same version-pinning advice applies. With CI/CD and a Renovate rule to bump component versions and trigger a rebuild, the maintenance overhead is low.
Final thoughts
The contrib distribution covers almost every use case, and running it long-term is a perfectly valid choice if your team has made that decision consciously rather than defaulting to it.
Ensure to check stability labels before relying on a component in production, pay attention to whether components have active code owners, pin versions explicitly, and treat deprecation warnings in your logs as actual work items.
For next steps: the Beginner's Guide to OTel Collector Pipelines covers the configuration model in depth. The Top 10 OpenTelemetry Collector Components guide is a good reference for the contrib components most teams end up using. And the custom collector guide covers OCB end-to-end.
